Deprivation and Health of Elderly in India: An NSS Based Analysis
March 2023 | Sabitri Dutta
I Introduction
Social exclusion has several dimensions in which people became disengaged from the mainstream society and are deprived of the services, rights and resources available to the rest of the population (Sacker, Ross, Macleod, Netuveli, Windle 2017). The manifestation of exclusion or deprivation happens in a number of interlinked problems that lead to the denial of opportunities available to majority present in the society. The major drivers of exclusion include ill health, poor economic condition, lower educational attainment, unemployment, homelessness, poor transport access and lack of sufficient social support (Bradshaw, Kemp, Baldwin, Rowe 2004). The mutual dependence of these factors makes it difficult to identify the direct risk factors, mediating factors and outcome of exclusion. Ill- health is generally considered as an outcome of exclusion (Burchardt 2003, Grundy and Sloggett 2003, Leone and Hessel 2016, Hawton, Green, Dickens, Richards, Taylor, Edwards, Greaves, Campbell 2011). There are interactions between social deprivation and health that consequently result in health inequality. Exclusion or deprivation of the elderly gains concentration in today’s world,
as population ageing is an inevitable and irreversible demographic process experienced by the entire world. Alam, Sivaraju, Gangadharan, Syamala, Verma, Gupta (2017) (India Ageing Report, 2017, UNFPA) report that by 2050 the number of elderlies at a global level will outnumber those who are under the age of 15. India is also experiencing this change in the demographic profile that throws Sabitri Dutta, Assistant Professor, Dum Dum Motijheel Rabindra Mahavidyalaya, Kolkata 700074, West Bengal, Email: sabitri.d@gmail.com a challenge to the social, economic and political domains. The major problem in this stretch of life is identified as deprivation from society and family.
The main reason for this deprivation is physical incapability that grows at this age and thereby non-participation in economic activities. There is a need of a policy that would increase their opportunity for physical, social and mental well- being. The process would also facilitate their participation in the society according to their desires, needs and capacities. They should also be provided with adequate security, care and assistance when they require them. A well-designed policy with this focus has a chance to reduce in practice, the deprivation and feeling of being excluded on the part of the elders.
It is important to identify factors that are responsible for deprivation and what effect they leave on the health of the elderly (aged 60 years and above). This paper attempts to find out those factors and then to quantify the extent of deprivation. It constructs a Social Deprivation index (SDI) combining the factors identified. It also attempts to examine the change in the deprivation across different socio- economic and health perception indicators. The feeling of being excluded may have some effect on self-perception about health. The association between the deprivation and self-rated state of health and change in state of health over the previous year (health transitions) have been studied.
II Data
The study uses National Sample Survey (NSS) 71st round unit level data (2014) on Social Consumption: Health. NSS adopted stratified multi-stage sampling method to collect data. The census villages in the rural sector and the Urban Frame Survey (UFS) blocks in the urban sector were considered as the First Stage Units (FSU). Probability Proportional to Size with Replacement (PPSWR) has been used for selection of FSUs in both the sectors. Households of both the sectors were treated as the Ultimate Stage Units (USU) to collect information from all Indian States and Union Territories (UTs). In the dataset, specific information is available about people of age 60 years and above. This includes their socio-demographic profile along with information related to their financial independence, living arrangement, physical mobility, number of living sons and daughters, number of dependents, their own perception about their current state of health and change in state of health. Data on use of health care services and allied information have been used in this work. Only the spell of one record of ailment in the last 15 days of survey has been considered. The number of such individuals is 6, 607 on whom the entire analysis has been carried out.
III Method
Construction of Social Deprivation Index (SDI)
The methodology has been followed from Sacker, et. al. (2017). The work identifies eight different indicators that represent social deprivation that may lead to health complications. On the basis of these indicators, eight variables have been created. They are whether the older person has availed medical advice for own illness (if not availed then 1 is assigned, 0 otherwise), the rating of the health care facility as ‘satisfactory’ or ‘unsatisfactory’ by the person (1 is allotted if rated ‘unsatisfactory’), whether the person is not using medical facility due to high cost (1 for not use), the ailment has been considered serious or not (1 for not considering serious), whether the person is covered under any health expenditure coverage scheme (1 if not covered), whether the person receives financial support from his children or grandchildren when the person is not financially independent and support comes from spouse and others (1 if not received), whether the elder is mobile on his own (1 when not mobile) and whether he or she is living alone or not (1 for living alone). All the variables are dichotomous in nature as only ‘0’ and ‘1’ values have been assigned.
The reasons for considering the above-mentioned variables are as follows. The social deprivation is considered higher if the respondent does not avail the medical treatment after falling ill. This represents lack of access and has been treated as an indicator of measuring health deprivation. If the health care facility is rated ‘unsatisfactory’ by the older respondent, it is also considered to indicate lack of access to good quality facility and hence deprivation. If the person’s illness is not treated as serious and hence is not given any treatment, it is considered that he/she is not given proper care, either by oneself or by the members of his/her family. So, it represents deprivation. If the respondent is living alone (either as an inmate of old age home or simply alone), he/she is treated to be excluded from the family. If the elder person is not mobile or needs help to move, it indicates his/her deprivation from the rest of the society. The social deprivation related to health also considers the deprivation arising out of financial reasons. If the person does not use the health care facility due to high cost, it is treated as an indicator of deprivation. Also, deprivation is considered to be present if the person is not covered under any health expenditure coverage scheme. If the respondent has sons or daughters living and is not receiving any financial support from them and he is financially dependent on others, then he/she is considered to be excluded. Social Deprivation Index (SDI) is constructed by summing up the values of these eight indicators. As there are eight variables, the SDI, theoretically can take values from 0 to 8. Here, the data reveals that SDI value does not exceed 5. Higher value indicates higher deprivation as in all the cases, 1 is assigned when the person is excluded.
In the dataset there are 6, 450 individuals for whom data on all the relevant variables for construction of SDI is available. So, the analyses which involve SDI consider only 6, 450 individuals.
Health Measures
Health measures include self-perceived current state of health (denoted onwards as SPHS) and self-perception about change in state of health over the year previous to the year of survey (denoted onwards as CHS). SPHS has three categories: excellent/very good (code 1), good/fair (code 2) and poor (code 3). CHS takes five values: much better (code 1), somewhat better (code 2), nearly the same (code 3), somewhat worse (code 4) and worse (code 5).
Confounders
The association between the SPHS and the SDI and also between CHS and SDI have been studied. The potential confounders identified from literatures are age (Arber 2004), age-squared, sex (male/female), education, place of residence (rural/urban) (Scharf, T., C. Phillipson and A. Smith 2005), marital status and the social group the person belongs to. On the basis of NSS data, some of the confounders have been recoded. The age used in the study is split into two categories: 60-75 years and above 75 years; education has been reclassified into six categories: illiterate, literate without formal schooling, with schooling-up to primary, up to secondary, up to higher secondary and graduation and above. Marital status has four classes: never married, currently married, widowed, divorced/separated. Social groups are Scheduled Caste (SC), Scheduled Tribe (ST), Other Backward Classes (OBC) and General. Marital status and social groups are taken in the raw form as available in the NSSO data.
Data Analysis Methods
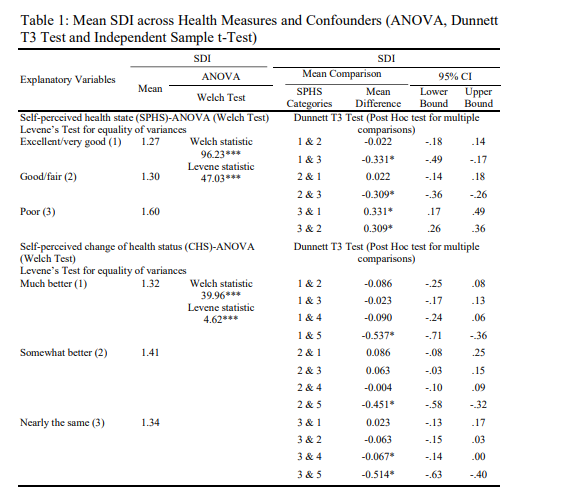
ANOVA is applied for testing the mean difference in the SDI values across different categories of SPHS. As one-way ANOVA can be applied only when the groups have equal variances, the Levene’s test for equality of variance has been carried out. The Levene’s test for equality of variance is coming out to be significant, implying the variances are not equal across groups (shown in Table 1). This discards the applicability of one-way ANOVA. Welch ANOVA is not sensitive to unequal variances and can be applied in this case. A similar test has been conducted to find any statistically significant difference in the means of SDI across different CHS groups. Significance of Levene’s statistic indicates that groups have unequal variances. Levene’s test is applied for the confounders as well.
As the ANOVA shows significance of overall mean difference and does not provide for difference between any two specific pairs, post-hoc test has been attempted. Dunnett T3 Test has been applied for the purpose of multiple comparison. The confounders also go through the same analysis. Independent sample t-test has been used for the confounders which has two categories. Dunnett T3 Test has been applied for multi-category confounders.
The association of health measures with SDI and other confounders is first checked by calculating pairwise correlation among the variables. In order to find the causality, two levels of regressions are run. In this connection two hypotheses are formed. First, the SDI affects self-perceived health status (SPHS). This is perhaps likely as SDI includes deprivation from health services as described before, along with other indicators of social deprivation. In this case SPHS is the response variable and SDI is the independent variable. Other independent variables included in the model are sex, age and age-squared, place of residence, marital status, education and social group. Age – squared is taken to capture the presence of any kind of non-linearity in age within the elderly group. An ordered logit model is used here as the response variable, SPHS is an ordinal multi- category variable with ordering from 1 to 3. The model is
logit (gci) = αc – (β1 SDI + β2 sexi + β3 agei + β4 (agei)2 + β5 sectori + β6 marital statusi + β7 educationi + β8 social groupi ); where gci is the cumulative probability gci = Pr(Yi ≤yc| xi); C = 1, 2 and c’s are called thresholds or cut-points.
The second hypothesis is that social deprivation predicts decline in health status over the previous year. In other words, SDI explains decline in CHS. Here the response variable is CHS with 5 categories with ordering. The regression model chosen is ordered logit. The explanatory variables are same as were in the previous regression. The model is
logit (gki) = αk – (β1 SDI + β2 sexi + β3 agei + β4 (agei)2 + β5 sectori + β6 marital statusi + β7 educationi + β8 social groupi ); where gki is the cumulative probability gki = Pr(Yi ≤yk| xi); C = 1, 2, 3, 4 and k’s are called thresholds or cutpoints.
Finally, investigations were carried out for obtaining the relation between health based SDI and sex, age, marital status, education and social group. Linear regression is conducted with SDI as the dependent variable.
IV Result
Social Deprivation and Self- Perceived Health State
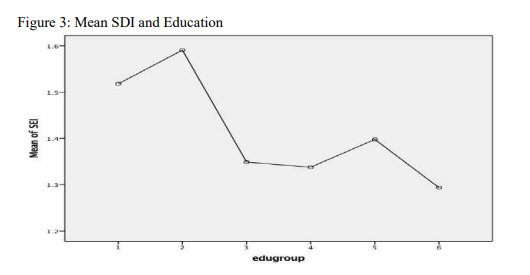
Welch ANOVA between SDI is carried out across different health perception status. The Welch statistic turns out to be statistically significant. This implies that the means of SDI are different across SPHS categories. Dunnett T3 test has been conducted to check the statistical significance of the pair-wise difference. Mean difference between the categories of SPSH ‘excellent/very good’ (code 1) and ‘good/fair’ (code 2) is not statistically significant but the difference between ‘good/fair’ (code 2) to ‘poor’ (code 3) is becoming significant with less than 5% level. Difference between codes 1 and 3 is also significant at less than 5% level. this is shown in Table 1. Figure 1 shows the difference in the means among the three categories of SPHS. A slight increase in SDI is observed from state 1 to 2 and sharp increase is found from state 2 to 3. Mean deprivation is higher as the self-perceived health state deteriorates. The statistical significance of the mean difference between state 2 and 3 is depicted by the steep rise of the curve in figure
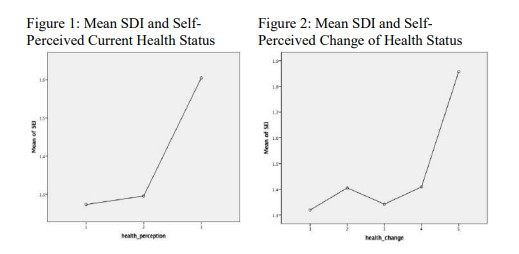
Social Deprivation and Self-Perceived Change of Health Status
The change of health status (CHS) has five categories as mentioned before. Levene’s test and Welch ANOVA come significant indication overall difference across CHS. The mean SDI alters significantly as the CHS changes to category 5 (worse) from each of rest of the four categories. Significance is also obtained when the CHS changes from category 3 (nearly the same) to category 4 (somewhat worse). It means social deprivation is higher for the elder individuals who perceive that their state of health has been worse over the year previous to the survey year than the elders who have said their health is much better than the previous year. Same is true between the groups who have a perception that their health is of nearly the same state (code 3) and those who thinks that their health state is somewhat worse (code 4) than the previous year. Statistical significance is not obtained for changes between other categories. Among all, elderly who perceive that their health has worsened has the maximum mean SDI. Figure 2 depicts the mean SDI for different categories of change of health. The average deprivation for category 2 is higher than that for category 3 but difference is not significant. Result is shown in Table 1.
Social Deprivation and Confounders
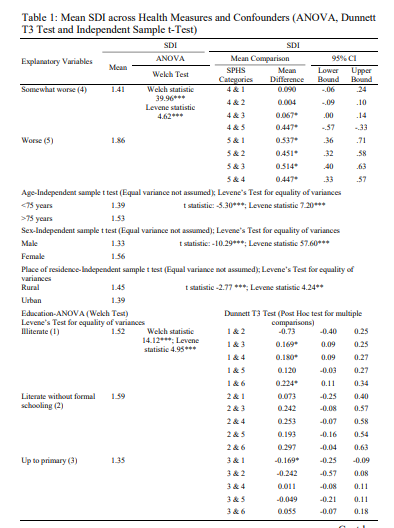
Levene’s test is significant across different confounders. Independent sample t- test (equality of variance is not assumed) shows that the deprivation of older elderly (more than 75 years of age) is significantly higher than that of younger elderly (less than 75 years of age). Age leads to deprivation after a certain threshold. At the age 75 or more, mobility problem is likely to become more serious and the individual is a victim of deprivation because he or she either cannot participate in the social activity or cannot socialise with relatives. In addition, the chance of getting coverage under a health scheme goes down as an individual enters the older elderly cohort from younger elderly cohort. Results from independent sample t-test shows that the average social deprivation for female elderly is more than their male counterpart. The difference is statistically significant at less than one per cent level. More deprivation has been found among older individuals residing in rural areas than those in urban areas. Statistical significance at less than one per cent level makes the result valid and meaningful. The result is shown in Table 1.
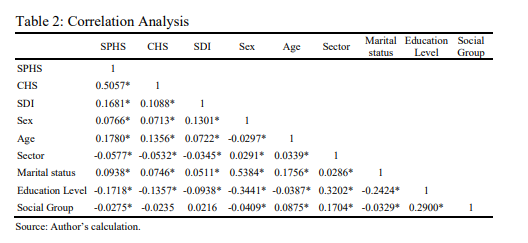
The difference of mean SDI between the illiterate (code 1) elderly individuals and those who are educated up to primary level (code 3) is significant. The average SDI for the former is higher. Same is true for those who are illiterate and educated up to secondary level (code 4) and educated up to graduation and above (code 6). Surprisingly, the difference is not significant between illiterate and educated up to higher secondary level (code 5). Figure 3 describes the mean SDI across different categories of education.
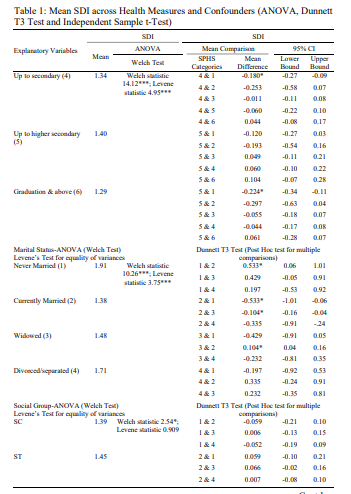
The highest mean deprivation (1.59) is observed for the elderly population who are literate without formal schooling though its difference with other categories is not coming significant. Mean SDI is the lowest (1.29) for the category having highest education namely graduation and above. Table 1 shows that people who are never married face higher deprivation than the married elderly and also than those who are widowed. The significance levels reported are one per cent and 10 per cent respectively. Widowed persons are more excluded than those who are currently married. Mean SDI (1.91) is the highest for the elderly people who are never married and lowest (1.38) for elderly married persons.
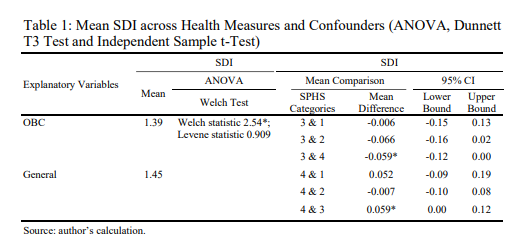
The differences in mean SDI among the categories of social groups are not coming significant except the difference between elderly belonging to OBC and General category. In fact, the mean deprivation is higher for General category than for the OBC with 10 per cent level.
Correlation
The correlation analysis is shown in Table 2. The pairwise correlations between both of the health measures and SDI are positive and significant implying presence of direct association of SDI with SPHS and CHS. It says that health and deprivation are related. Females are vulnerable in terms of both of the health measures as shown by the significant positive correlation of the variable ‘sex’ with SPHS and CHS. Age also has a direct relation with SPHS and CHS. Deprivation also increases with age. Urban people are well-off in terms of SPHS, CHS and SDI. Marital status is positively correlated with both health and deprivation measures. Negative significant correlation is found between education level and SPHS, CHS and SDI. Social group is showing a negative significant relation with SPHS and no significance is obtained for the CHS and SDI.
Regression Analysis Result
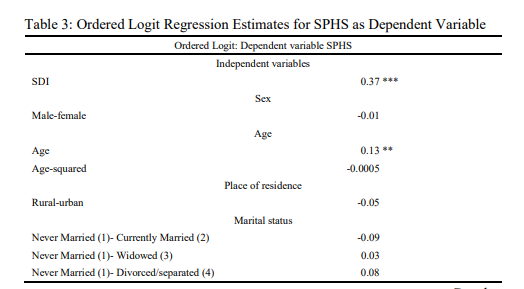
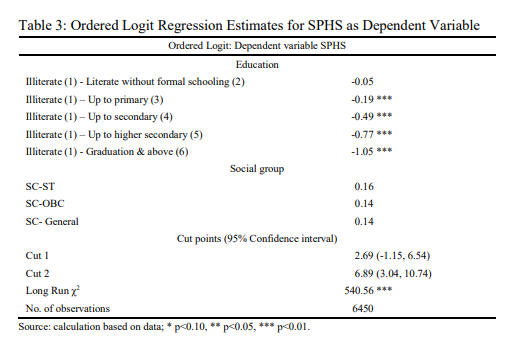
The results of the regression analyses are shown in Table 3 and 4. Category 1 for all the categorical variables has been taken as the reference category.
Table 3 shows the impact of SDI and other explanatory variables on SPHS. Deprivation affects self-perceived health status with less than one per cent significance level. Positive coefficient implies a decline in health status due to increase in deprivation. The sex of the elderly does not affect SPHS significantly. Health deteriorates as age increases, but no non-linearity was observed in age. Place of residence, marital status and social group do not show any significant influence on SPHS. Education level is an important factor in determining SPHS and shows significant coefficients with expected sign. Cut points are 2.69 and 6.89 which determine the latent structure of the SPHS variable. Long run χ2 is significant at one per cent level, making the overall regression meaningful.
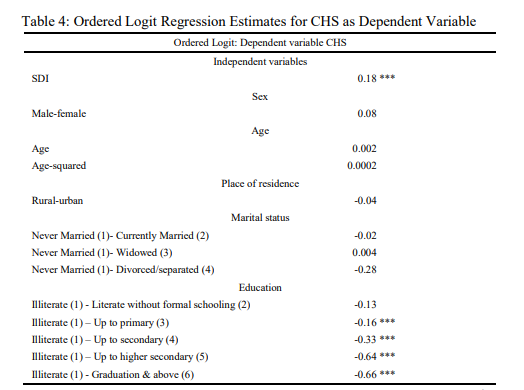
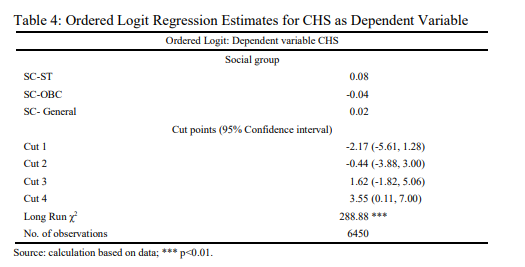
Table 4 depicts the effect of social deprivation on the change in health status over the previous year. It is found that deprivation leads to decline in health from the previous period. The result is significant at one per cent level. This work fails to find any significant relation between CHs and sex, age, place of residence, marital status and social group. Improvement in education level helps to attain improved health in the current period over the previous. Upliftment from ‘illiterate’ to ‘primary’ and higher show significant improvement in the health transition. As CHS has five categories, four cut points are obtained and reported in the table with 95 per cent confidence interval. Significant value of long run χ2 keeps the overall regression meaningful.
Regression analysis results described in Table 3 and 4 show that current health status and health transition are influenced by the social deprivation when control is given for other confounders. The odd ratios are shown in Table 5.
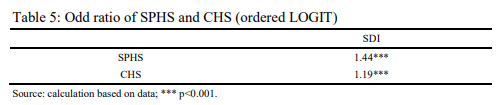
Findings show that increase in deprivation results in deterioration of SPHS as well as CHS. For one-unit increase in SDI the odds of high values (poor) of SPHS versus the combined middle (good/fair) and low values (excellent/very good) of SPHS is 1.44 times greater, when other variables are taken constant. Similarly, the odds of CHS to be worse with respect to other categories taken together is 1.19 times higher for each unit increase in SDI. So, health and deprivation are related. The results are significant at less than one per cent level.
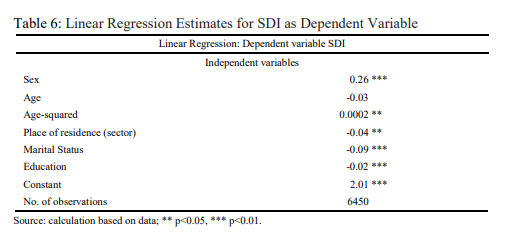
Table 6 reports the response of SDI across sex, age, marital status, and education. This establishes the relation between the social deprivation and different confounders. As social group has not shown any significant result, the variable has been dropped in this analysis. Females suffer more deprivation. The result is statistically significant. The variation of SDI with age is obtained after a threshold age within the elderly age group is reached. The positive significant coefficient of age-squared reflects that. Urban elderly people are less excluded. Deprivation increases for currently married and widowed individuals. Education plays an important role in reducing deprivation. Deprivation is less when education level among elderly rises.
II Discussion
This work tries to use an analytical framework for understanding health and social deprivation among elderly by establishing a link between measures of health and those of social deprivation. Confounders have been chosen to understand the factors affecting the deprivation in older age. Results are more or less consistent with expectations. Positive and significant coefficients of SDI in both of the regressions indicate that the deprivation and health are related. This happens because the SDI includes indicators that considers deprivation from health services along with other measures of social deprivation. So, it is likely that the higher SDI and poor health status are associated. The poor perceived health may happen as there is lack of access to the health facility, not considering the health problem as serious, financial stringency, problems of mobility, of living alone and of not being covered under any health scheme. The same explanation applies for the cohort which says that their health has been worse than the previous year. Higher deprivation explains worse transition of health. Social deprivation predicts the change in health perception. The indicators used for constructing the SDI are likely to be absent grossly or partially in the groups that consider their health to be excellent or good. The current health status declines as age increases. Higher age at this period comes with less mobility and less participation in the society. The relative risk strengthens the claim that those who are poor and have worse health suffer more deprivation.
The variation in current health status is not found within the elderly age group. Once they reach the elderly stage and lose ability to participate in the production activity, they suffer from limited mobility and get excluded from accessing health services and consequently, health is affected. Probability of Older adults suffering from physical and mental decline is associated with old age. This symptom of senility leads to deterioration of cognitive functioning. They need more attention from near ones, more frequent treatment and the required financial coverage. Females are more excluded, in general. The lack of financial independence is an added problem for the Indian females, particularly at this age. Health facilities of satisfactory quality is not generally available in rural areas leading to higher deprivation for the rural residents. Being unmarried leads to higher deprivation probably due to lack of company at the time when spouses need one another more intensely, mainly to cope up with the physical problem and more for getting rid of the mental loneliness at this age. Education is identified as a factor that significantly affects the deprivation. It may be so because of the enhancement of awareness and financial strength due to better job in the working age for the educated elderly. Education is also important in predicting SPHS and CHS. More education implies better perception about current health as well as change in the health status. Better education is a saviour from deprivation.
This work fails to find association between the social group and the deprivation. There exist a number of other mechanisms that might explain the relation between social deprivation and health. Examples include access to car, mobile phone, internet, material and financial consequences of poor health, environmental factors and others beyond those considered here. The study may improve with the help of civic participation data for elderly, transport data, data on participation in the association of elders etc. Due to want of relevant data inclusion of these indicators in the analysis is beyond the scope of this study.
III Conclusion
Health and social deprivation are associated. There exists synergy between the two. The finding of the study suggests that risk is higher for those who are suffering from greater deprivation. Both current health and transition in health are affected. Reduction in deprivation is a way-out for gaining better health. Improvement in the access to the satisfactory health facility may be a potential solution. Along with that, better education for the younger people may provide a remedy. It has, in fact, a two-way benefit. On the one hand, education for the younger generation would create awareness and better sense among them which would stop them from abuse of the elderly and to take measures to provide solutions to the problems of loneliness that their parents face. On the other hand, those who are younger today will be elders tomorrow. Better educational background would help them to find a better job so that they become financially dependent and take care of their health expenditure on their own when they enter into older age. Moreover, education enhances awareness. This increases the chance of elderly receiving health care in time instead of postponing the treatment considering the illness as ‘not so serious’. A wider coverage of the Government health scheme for the elderly should be in place as a possible solution to the problem of health-based deprivation. Any specialised scheme for the widowed elderly may reduce deprivation. More inclusive supply of Government health facilities specially in the remotest part of the country is necessary to cater to the needs of the rural elderly. A free or subsidised provision of old-age homes by the Government with necessary health facility at villages as well as city level can serve a large part of elderly population that suffers health problems due to lack of timely care. In addition, the association that they get at the old-age homes can reduce the feeling of being excluded which, in turn, has a favourable effect on health. Another potential solution to this health and financial deprivation of the elderly people can be brought through inclusion. This can be made possible if the people of this age cohort can participate in productive activities. This is not practically possible because of their physical inability. Increase in the retirement age can be one possible way to include the early elders in the production. But the solution may not sustain as the age increases. Physical incapacity may not always lead to mental ineptitude. Elders can be included in the production process by transmitting their ideas to the younger generation. They can be used to innovate plans leading to new production possibilities. Care activities by the younger for the older along with this flow of knowledge and ideas from the latter to the former have the potential to address the unemployment problem for the youngsters as well as deprivation blues for the elders, at one go.
References
Alam, M., S. Sivaraju, K.R. Gangadharan, T. Syamala, S. Verma and N. Gupta (2017), Caring for Our Elders: Early Responses, India Ageing Report – 2017, New Delhi, India: UNFPA.
Arber, S. (2004), Gender, Marital Status, and Ageing: Linking Material, Health, and Social Resources, Journal of Ageing Studies,18(1): 91–108.
Bradshaw, J., P. Kemp, S. Baldwin and A. Rowe (2004), The Drivers of Social Exclusion: A Review of the Literature, London: Social Exclusion Unit, Office of the Deputy Prime Minister.
Burchardt, T. (2003), Being and Becoming: Social Exclusion and the Onset of Disability, CASE Reports: ESRC Centre for Analysis of Social Exclusion, LSE.
Grundy, E. and A. Sloggett (2003), Health Inequalities in the Older Population: The Role of Personal Capital, Social Resources and Socio-economic Circumstances, Social Science and Medicine, 27(56): 935–947.
Hawton, A., C. Green, A.P. Dickens, S.H. Richards, R.S. Taylor, R. Edwards, C.J. Greaves and J.L. Campbell (2011), The Impact of Social Isolation on the Health Status and Health-Related Quality of Life of Older People, Quality of Life Research, 20(1): 57–67.
Leone, T. and P. Hessel (2016), The Effect of Social Participation on the Subjective and Objective Health Status of the Over-Fifties: Evidence from SHARE, Ageing and Society, 36(5): 968–987.
National Sample Survey 71st Round, Schedule 25.0, Social Consumption: Health.
Sacker, A., A. Ross, C.A. Macleod, G. Netuveli and G. Windle (2017), Health and Social Exclusion in Older Age: Evidence from Understanding Society, The UK Household Longitudinal Study, Journal of Epidemiology and Community Health, 71(7): 681–690, doi:10.1136/jech-2016- 208037
Scharf, T., C. Phillipson and A. Smith (2005), Social Exclusion of Older People in Deprived Urban Communities of England, European Journal of Ageing, 2(2): 76–87.