Education and Intergenerational Mobility
March 2023 | Kranti Kapoor
A liberal democratic system should ensure intergenerational upwards class mobility. In a rigid class society, the class structure of the society will reproduce itself from generation to generation. Ever since the beginning of the first industrial revolution, questions have arisen about the efficacy, sustainability and moral desirability of such system. One extreme rigid form of such a society is the class and caste system prevalent in India for centuries. However, in the modern times, such systems obstruct rapid development of the society as also of the elites. Rapid economic development requires that opportunities for mobility be available to all segments of the society and education is that one tool through which this can be achieved. The contribution of education in intergenerational class mobility is examined in this paper.
The intergenerational linkages between education and occupation can operate through a number of channels. Some of these channels are tangible, like parents’ investment in children’s education and access to parents’ social connections, knowledge and experience. But some are intangible like nurturing, guiding as well as teaching one’s own wards as well as genetic transmission of ability and preferences (Bowels, Gintis and Osborne Groves 2001, Durlauf 2000).
In general, the cultural reproduction hypothesis stating that social, parental, family and cultural backgrounds and father’s education are the strongest determinant of the child’s education is validated from foreign as well as Indian
Kranti Kapoor, Assistant Professor, National Law University, Jodhpur 342304, Rajasthan,
Email: dr.krantikapoor@gmail.com
studies, old and new (Graham an Hernendez 1994, Govinda and Varghese 1992, Upendranath 1993). Several empirical studies suggest that the expansion of education itself reduces educational inequality after a threshold level of education is achieved (Ram 1990, Jonsson 1989, Mehta 1993). Mehta obtains a threshold level of 4.55 years of schooling, as against 6.8 years obtained by Ram.
Emran and Shilpi (2012) examined post reform trends and patterns of intergenerational mobility among new entrants in the labour force (16-27 year olds) between 1992/93 – a year immediately following the economic liberalization in India – and 2006 – nearly 15 years after liberalization. Using data from National Family Health Survey (NFHS), they find that educational mobility is almost stagnant for majority of Indian children. Similarly, Jalan and Murgai (2007) find a declining effect of parental education for the younger age cohorts for both the survey years. They also observe increasing educational mobility across groups of individuals.
The relation between educational and occupational/class mobility has been examined by preparing and examining origin-destination flow tables and using affinity or cohesion measures (Erikson and Goldthorpe 1992, 2002), (Jonsson 1989, 1993a), (Kapoor and Mehta 1997), (Kumar, Heath and Heath 2002a, 2002b), (Behrman, A. Gaviria and M. Szekely 2001), (Beller and Hout 2006), (Louw, Van Der Berg, Servaas and Yu 2006).
In their research, (Hnatkovskay, Lahiri and Paul 2012) use five rounds of NSS surveys (1983, 1987-1988, 1993-1994, 1999-2000, and 2004-2005), and aggregate occupations in three groups (white collar, blue collar and agriculture). Based on occupation switches, in which sons’ occupation is different than fathers’ occupation, they find that the probability of an occupation switch has steadily increased from 32 per cent in 1983 to 41 per cent in 2004-2005. For social groups other than SC/STs the switch probability increased from 33 per cent to 42 per cent while for SC/STs it has gone from 30 to 39 per cent. They conclude that difference in intergenerational mobility between SC/STs and non-SC/STs has not changed over this period.
I Education and Class Structure: The Models of Class Transmission
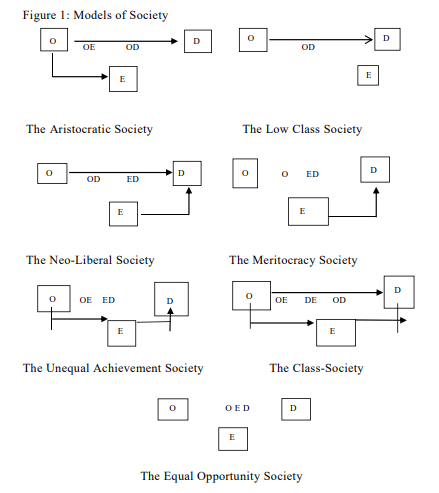
Various possibilities of origin-destination transmission of class position from parents to children with the intermediation of education can be stated. Six models of transformation of social relations in modern day societies as described by (Jonsson 1993) are relevant here. One more variant of the Aristocracy is added here for serving as a bench mark model.
- The Low Class Society: This model describes a low-technology feudal society that reproduces class structure without assigning any role to education.
- The Aristocratic Society: It is a low class society where only aristocratic class gets higher education for reasons other than economic.
- The Neo-Liberal Society Model: In this type of society, importance is accorded to education as well as class of origin in determining destination class position. While class positions are inherited from parents in some occupations like farming, crafts and business, in many others, class positions can be attained on the basis of achieved qualities of the individuals through education and training. This model represents a liberal capitalist society.
- The Meritocracy Model: This is a high education society. In this ideal society, both educational attainment and social destination are independent of social origin. Education is the only criterion on which class position depends. For attaining a high position, an individual must have excellent educational background. Moreover, every citizen has effective equal opportunities to obtain whatever level, type and quality of education he or she chooses to have.
- The Unequal Achievement Society Model: Class reproduction in this model is routed through education. It is not determined directly by origin. However, education is itself class based. Merit is rewarded. But the option of acquisition of merit is not open to all.
- The Class Society Model: In this type of society, both education and class positions are determined by origin and background characteristics. This is a class reproduction society in which class position is inherited directly as well as indirectly through the mediation of education. Education is just an instrument in class reproduction and class rigidity. Here education opportunities are not available to the poor and deprived.
- The Equal Opportunity Society Model: This is an ideal society. In this type of society, social mobility is very high and is not at all related to an individual’s socio-economic background whether through education or otherwise. Society provides equal opportunities to all its citizens, irrespective of their caste, ethnicity, parental class, parental cultural grouping, community of residence, religion or any other background characteristic.
Historically, most of the societies start as Low Class societies, developing into Aristocracies, and, in the absence of state intervention in the education and job markets, develop into Unequal Opportunity societies or pure Class Reproduction societies. State intervention in education and job markets will have to become a reality for transforming the Class Society to a Neo-Liberal society and ultimately to a Meritocracy.
The six models described above are presented graphically in flow charts in Figure1. In these flow charts, O denotes social origin (respondent’s father’s social class), E level of education of the respondent and D destination class of the respondent. An arrow shows the direction of the relationship.
II Testing the Social Reproduction Hypothesis
The models can be tested in several ways. Three methods are used here:
- The simplest method is to study the influence of social and cultural origins and other background factors on (i) education, and (ii) economic outcome separately as also the influence of education on economic outcome. The Regression method is used.
- The second method is named as Lottery method: Class/Social outcome is the result of two lotteries: Education Lottery and Employment Lottery. The expected origin-destination pattern is predicted on the basis of these lotteries and compared with the actual distribution.
- Log-linear Modelling. The respondents are cross-classified by class of origin, education level attained and class of destination. The distribution of cell frequencies is explained on the basis of the interaction terms introduced one by one or in combination as implied by each of the seven models. These results are then compared and interpreted.
III The Study Area
The study is confined to Jodhpur Parliamentary constituency of Rajasthan in India. Two assembly constituencies Soorsagar and Luni out of the total nine constituencies were selected randomly for this study. “Electoral roll Rajasthan 2014” was downloaded from the site on May 18, 2014. At the second stage, 10 per cent of the booths in each constituency were randomly selected. Luni and Soorsagar have 244 and 178 polling booths, respectively. Thus, 24 and 18 polling booths of Luni and Soorsagar constituencies were selected. At the third stage, 10 per cent of the voters in the list of these randomly selected polling booths were randomly selected for intensive investigation. Thus, more than 5000 male and female voters between ages 20 to 60 years from rural and urban areas were covered. Field study was conducted during August 2014 to May 2015. In all, the responses of 2788 male and 2150 female respondents were found to be complete and reliable. Since only 156 women out of a total sample of 2150 women reported working in this survey, only male respondents have been considered in the class models in the present paper.
Testing through Separate Regressions
The following equations are estimated for male respondents:
dedu2 = f(fo2 , fe2 , MUS, SCST, High Caste, Urban, Trend) …(1)
doc2 = f(fo2, fe2, edu2, MUS, SCST, High Caste, Urban, Trend) …(2)
doc2 = f(fo2, fe2, edu2, MUS, SCST, High Caste, Urban, School type, Medium, Trend …(3)
It is to be noted that d stands for destination (respondent’s) score1 and o for origin (respondent’s father’s) score. dedu2 is the education score (or E is total years of education) of the respondent, doc2 is the class score of the respondent and fe2 and fo2 are the education and class scores of origin, that is better or higher out of the parent’s scores, High Caste stands for High caste Hindus including Jains,
MUS for Muslims, SCST for scheduled castes and tribes and OBC for OBC castes. Urban/Rural origin variable is also introduced. Trend variable from the oldest to the youngest respondent is also introduced.
Origin Characteristics and Education
In Table 1, father’s education and caste/social group are the most significant factors affecting the achievement of education level by the respondents. SCST, Muslim and rural origin male respondents are the most disadvantaged sections. It should be remembered that OBC caste is the reference caste category. Boys born in High caste urban families get far higher education than those born to Muslim and SCST families both in urban and rural areas. Father’s class score is also significant even in the presence of these other background characteristics.
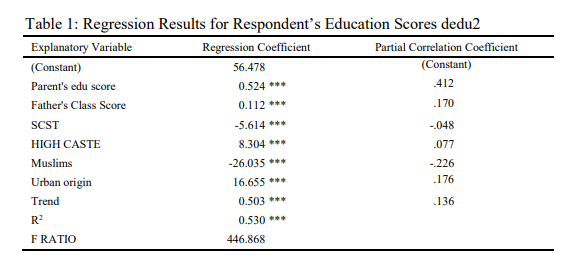
The explanatory power of the model is weak in the case of male respondents. In the destination education model for the male respondents, from the partial correlation coefficients, we see that parent’s education and urban birth, each explain about 17 per cent of the variance, followed by Muslims (five per cent) and origin class (three per cent). Others factors explain even smaller proportions, though the coefficients are statistically highly significant. The total so explained is much smaller than R2 value of 0.53. Thus, interaction between different origin characteristics explains the remainder. Background variables are dominant factors in the education of the respondents. Educational inequities are transmitted from generation to generation. However, significant positive trend over time, points towards significant overall improvement and lift in education level over time.
Determinants of Destination Class
Regression results for destination class-score (doc2) throw up interesting results (Table 2 and 3). All origin class and other background variables are not only
significant with proper signs but retain their significance even in the presence of own education variable. Introducing destination education score as explanatory variable, R2 is raised to .780 from .578. This result points towards existence of a class reproduction society. About 34 per cent of the variance is explained by father’s class (class origin)1, followed by own education (about nine per cent), interaction explaining the rest.

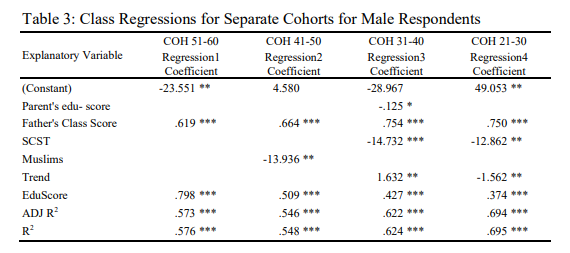
The Pattern in Cohorts
Applying step by step regression for different cohort data on the Male respondents, the first thing to note is that the fit has considerably improved from the oldest cohort to the youngest one evidenced by a rise of R2 from .576 to .695 and that the intercept term has become positive and statistically significant in the youngest cohort (Table 3, p. 11). There is significant negative trend within the cohort. Thus, in general class position has improved between the cohorts. However, SCSTs
continue to be at a disadvantage. The coefficient for origin class has improved and is still highly significant determinant of destination class position. Another feature is that own education continues to have positive influence on class position, though the coefficient has declined considerably from the oldest to the youngest cohort. Thus it seems that over time the importance of class origin has become dominant and intergenerational class mobility has declined.
It is, thus, firmly established that social class, cultural class and caste origins are the crucial factors in determining schooling achievements. Though taken separately, caste, cultural origin and class origin explain the very high proportion of the differentials in educational achievement; when all these are put together in the list of regressors, the importance of class is reduced drastically and that of cultural origin substantially, caste is still the main discriminating factor in the education market. Again, though the model explains about 53 per cent of educational differentials, a large part of the variance is explained by the joint effect (covariance) of these variables, showing that there is a large association between the background characteristics.
Social, class origin, cultural origin and schooling are the crucial factors in determining class positions. Taken separately, the origin class, caste and origin education factors influence about 55, 40 and 44 per cent variance in class destination. However, since the importance of the class origin and caste dummies are reduced considerably in the presence of the schooling variables, the transmission of class position is mediated through education. However, the partial effect of class variables controlling for schooling, is not so strong.
Education and Class structure in India: Lottery Model
In Lottery Analysis the idea of ultimate class and income positions as an outcome of several lotteries has been developed on the basis of the work of Checchi D, 1997.
Lifetime prospects may be considered to be an outcome of two lotteries:
- Educational lottery
- Job lottery given education
Two transition matrices correspond to these lotteries:
- A child origin class (OC) to his education (DE) lottery: (OC-DE)
- An education DE – destination class lottery: (DE-DC)
Current occupational class is taken to represent the class position of the respondent. The best class position of father is taken to be the origin class position. Hence, two flow matrices are prepared: OC-DE (or simply, OE, origin determining off-spring’s education) and DE-DC (or ED, education determining class)).
Hence, the origin to destination probability expected on the basis of the two lotteries is given by the compound probability matrix:
ODe= (OE) (ED),
where (OD)e is the expected origin to destination class flow matrix. Comparing this expected matrix with the actual flow matrix between origin and destination occupations or classes (OD) will tell us the extent to which inter- generational social mobility (or lack of it) is mediated through education. Simple Chi-square is calculated to test the association.
To reduce the possibility of zero or very low cell frequencies, the class and education categories are reduced to four each.
The new class categories are:
- High, combining High Economic Class and Petit bourgeoisie class
- NMW+SW, combining the Non-Manual Workers and Skilled Worker classes
- CULT., the cultivators
- UNSW+ AgL, Unskilled Working Class and Agricultural Labourers
The education levels are:
- Illiterate including literate without schooling
- Elementary, those educated up to Eighth Class
- High School, Secondary, Senior Secondary School educated
- Degree and Higher educated
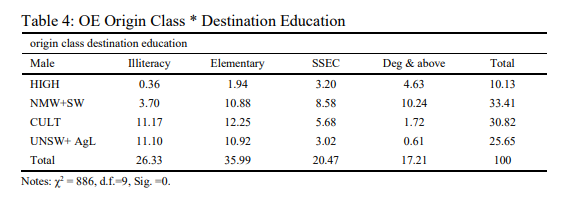
Class Origin and Destination Education – OE: The Education Lottery
The chances of obtaining different levels of education by male respondents of different class origin are given by Table 4. The relationship is very strong as revealed by the χ2 value (886) of the distribution of son’s education level by his father’s class position. The very high value of chi-square substantiates the hypothesis that education is basically class based in India. Of the 10.13 per cent respondents originating in HIGH class nearly 46 per cent are degree holders and 32 per cent have completed schooling, illiteracy/low education is reported by only by 3.5 per cent. In contrast, of the working class respondents, about 43 per cent are near illiterate and about the same per cent are only elementary level educated.
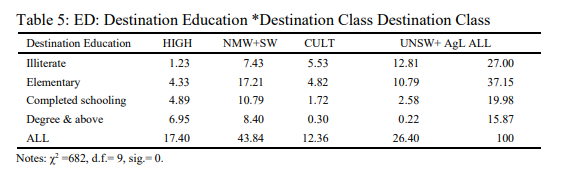
The Labour Market Lottery: Education and Occupation – ED
Education is an important screening factor in the labour market. Table 5 confirms the hypothesis that education of the respondent is highly significant in explaining his or her class attainment. The chi-square value is very high implying that class position is not independent of education. Highly educated (Degree) males achieve high class position (TOP and PB = 43.80 per cent) and NMW (52.90 per cent) whereas illiterate are exclusively fated to be in the rural and urban proletariat classes. To be in the SW class school education is enough. To be in the TOP class requires a university degree.
Thus, class of origin determines education of the off-spring and their education determines their economic achievement. Let us see the end result of the two lotteries.
The Result of the two Lotteries: Origin and Destination
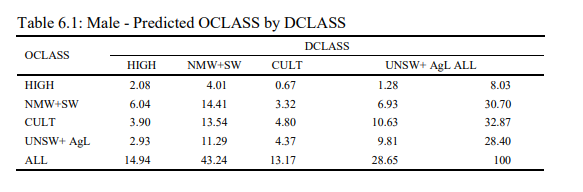
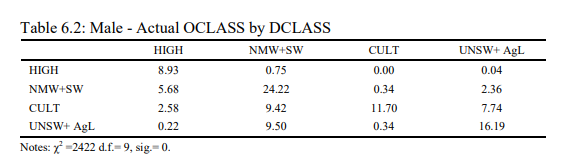
The 4×4 OE matrix is multiplied by 4×4 ED matrix, normalized with respect to total respondents equal to 100. Table 6.1 gives the expected class composition (OE)e of the male respondents on the basis of the two lotteries. It predicts the chances of sons inheriting the same occupational stratum as the father’s or entering the other strata on the basis of level of education achieved. More exactly, the present class position of an individual is predicted on the basis of his or her education level achieved on the basis of the class origin. Table 6.2 gives the actual or observed origin to destination class distribution.
Chi-square values are then calculated for each class and all classes combined by the formula:
χ2= ∑(fij- f e)2 / fij
where, fij is the frequency in ith origin and jth destination class. The exponent stands for the expected frequency from the matrix (OE) (ED). Table 7 gives the Chi- Square values so calculated.
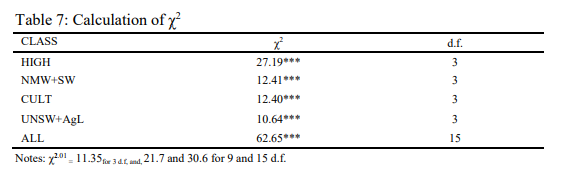
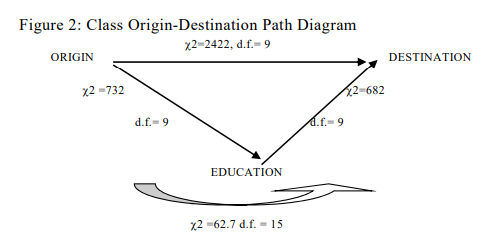
Chi-Square values reveal that the actual transmission of class positions is significantly different from that warranted by class based education. However, it may also be noted that χ2 value for the actual distribution of O by D is 2422 for males for 9 degrees of freedom which reveals class reproduction. However, χ2 on the basis of the distribution predicted by (OE) (ED) is much lower at 62.7 for the same number of degrees of freedom (see Figure 2, p. 16). Thus, considerable class reproduction is through class based education. Hence, there is direct transmission as well as that mediated by class based education. However, since χ2 for distribution of destination occupation/class by education (ED) is very high at 682 for only 9 degrees of freedom in men, hence, education determines to a very large extent the ultimate class distribution in the society. Taking all these into consideration, it may be concluded that a large part of class distribution can be explained on the basis of class based education and the rest emerges because of (i) structural changes in the occupational distribution with development, (ii) direct transmission of class positions (through inheritance and privileged position), and
(iii) through general expansion of education benefitting all sections.
Testing the Mobility Models: Log-Linear Modelling
Regression models for social and cultural classes used in this and other exercises in social sciences require using summary measures of social class. The Lottery method does not give attention to the various interactions between the cultural and class variables considered. The method of Log-linear modelling has been devised to consider the interrelation of the origin class, destination education and destination class variables (Knoke and Burke 1980, Jonsson 1993) to arrive at the nature of intergenerational mobility. However, in the process, the other origin factors like caste/social group, gender, community of residence and educational/cultural origin are not considered in this exercise.
In our log-linear models, the interaction between two or all of the multinomial variables – class origin, class destination and education – are considered. The effect of different interactions of the variables can be found out step by step by suppressing one or more of the possible interactions. The Equal Opportunity Model is taken to be the bench mark model. The model is expected to throw light on the role of education in intergenerational class mobility, other things remaining same.
As in the case of the Lottery method, the various educational and class categories have been reduced to four categories each, so that zero and very small cell frequencies and cell totals are avoided since these (small frequencies) may arise because of sampling fluctuations. It helps in taking log of the frequency as the dependent variable. Moreover, by reducing the chances of small frequencies, the results are rendered more reliable.
Destination class (D) by origin class (O) by destination education (E) are cross-tabulated for respondents. There are, thus, 64 cells. The frequencies in these cells are noted. Let Fi,j,k be the cell frequency for ith destination class, jth origin class and kth destination education level. Natural logarithm of F is taken as the dependent variable. Had there been random distribution of positions, all cell frequencies would have been in proportion to the column and row sub-totals. Obviously, this is not so. The divergence from randomness is to be explained by
the three origin and destination factors. Log-linear modelling is attempted for this. The model is:
Log F i,j,k = a + b1 O + b2 E + b3 D+ b12 OE + b13 OD + b23 ED + b123 OED
Where, i.j.k vary from 1 to 4, and a is the log of the intercept term and b‘s are vectors of the estimated parameters for measuring the effects of Class origin, Education and Class destination and their interactions.
O, E, D are the matrices of three origin class dummies, three destination education dummies and three destination class dummies. One dummy in each of these is dropped to avoid multi-collinearity and to make it possible to estimate with the intercept. OE, OD, ED each represents matrices of 9 cross products of dummies. Their coefficients will represent the effect of the interaction of a combination of two factors at a time.
As mentioned above, there are 64 cell frequencies. However, 12 of these are found to be zero. These cases are dropped. Thus n is equal to 51. The total sum of squares (TSS) in the dependent variable (log F) is 26.69 for 51 degrees of freedom. Different models are fitted. The explained (ExSS) and error or residual sum of squares (RSS) are obtained for each of these models. These are given in the upper panel of Table 8.
The first model tested is the Equal Opportunity Model. Total sum of squares is reduced by 5.70 for a loss of nine degrees of freedom. Adj.R2 is quite low, the fit is poor. Almost 79 per cent of the variance is left unexplained. Thus, the Equal Opportunity Model does not hold true here. If one interaction between education and destination (ED) is introduced (Meritocracy Model), the explained sum of squares doubles and R2 rises to 0 .42 with a further loss of nine degrees of freedom and is statistically not significant. The Jodhpur society is still far away from Meritocracy.
The “Neo-Liberal” model is tested with two interactions: between origin and education (OE), and between origin and destination (OD) added to the baseline line model. The Explained sum of squares rises to 23.78 for a loss of 8 more degrees of freedom. There is a very large improvement in the fit (R2=0.89) over the Equal Opportunity model as well as Meritocracy model. The relationship is also statistically highly significant. However, the Aristocracy model also gives equally good fit (R2= 0.87).
The best model seems to be the Class Society Model wherein three way interactions between class of origin and education (OE), between education and class of destination (ED) and between class of origin and class of destination (OD) are introduced, R2 is as high as 0.98 and R2adjusted for the loss of 35 degrees of freedom, is also at 0.94. Almost all variance is explained.
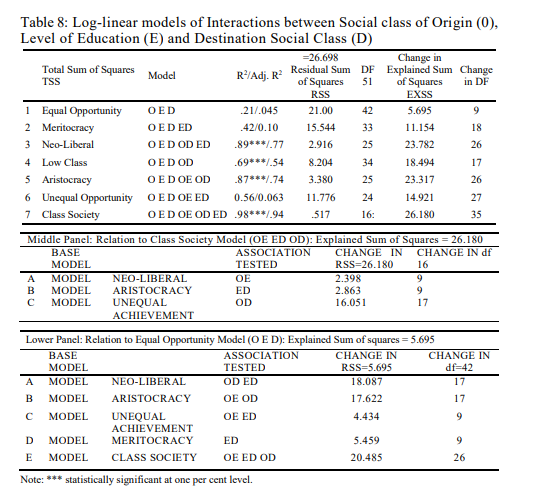
It may be noted that the “Low Class Society Model” which includes an education mediation term, though statistically significant, does not perform so well. Adjusted R2 is only 0.54 which is much lower than in the other class models. It can thus be said that the Indian economy can no more be described as a pure low level feudal economy.
Thus all class significant models are class reproduction models with or without the intervention of education, ranging from Low Class Society, Aristocracy and Neo-liberal, to the Class Society models.
Since perfect mobility and rigid social reproduction are the extreme points on a scale measuring association between class origin and class destination, an attempt is made to compare the associations in relation to these two extreme cases.
Departure from Perfect Mobility Model-the Equal Opportunity Model (Table 8 Lower Panel)
The upper panel of the table shows that the equal opportunity model leaves 79 per cent of the total variance to be explained. The perfect mobility model explains only
5.69 of the total variance of 26.698, leaving the rest unexplained. In the lower panel of the table all other models of are judged in terms of reduction of variance with respect to equal opportunity model and the loss of degrees of freedom involved. Compared to Equal Opportunity Model, the Neo-Liberal model cuts
18.087 points from the total sum of squares for a loss of 17 degrees of freedom. The Aristocracy Model reduces variance by a total of 17.62 for a loss of 17 degrees of freedom. The class society model knocks down 20.49 points from the variance for a loss of 26 degrees of freedom. These are the farthest from the equal opportunity model.
Departure from the Class Society (Reproduction) Model (Table 8, Middle Panel)
In the middle panel, the relative strength of neo-liberal, aristocracy and unequal achievement models is explained. The importance of three interactions is tested by dropping one by one. The strongest relation is between origin and destination (OD). By removing this association, i.e., OD from the class society model, 16.051 points of the sum of squares lost for 17 degrees of freedom. By removing origin- education from this model, 2.398 points and by removing education- destination class, 2.863 are lost for a gain of 9 degrees of freedom. The result shows highest independent importance of origin class in determining destination class directly. In comparison, the influence of education-class and class-education relationships are much smaller.
II Conclusions and Lessons
The process of economic and technological development is causing structural changes in the class structure of the society. Thus, there has been considerable structural mobility of all social classes. However, class origin is still the dominant factor determining class destination. In fact, the performance of the “Class Society” Model is the best. Thus, the existing social inequalities in the society are either inherited directly or achieved through education. The next best fit is that of the Neo-liberal society which shows that educational attainment independent of social origin also helps in achieving social positions. This process, therefore, helps in inter-generational social mobility and acts as a social-lift. It is also seen that in the regression analysis, father’s education is not significant in the presence of own education in determination. Thus education has started playing its role in accelerating class mobility. The weakest association, though still highly
significant, is the one between origin and education, whereas the strongest association is between education and class destination.
In all the models, a large proportion of the variance remains unexplained; there is considerable mobility independent of the background or origin characteristics or factors not included in the study. The effect of some of these e.g., caste, gender, community of origin have been considered at different places in this study while the effect of some others could not be studied.
Endnote
1. Education and occupation scales or scores (as designated by Erikson) were prepared after the data was collected and processed. For assigning scores on a scale, average income earned by the respondent in various educational and occupational categories was computed from the data collected. The lowest educational category is taken as the respective reference categories equivalent to 100.
References
Behrman, J.R., A. Gaviria and M. Szekely (2001), Intergenerational Mobility in Latin America, Inter-American Development Bank/RES, Working Paper 452.
Beller, Emily and Michael Hout (2006), Intergenerational Social Mobility: The United States in Comparative Perspective, The Future of Children, Fall, 16(2): 19-36.
Bowles, S., H. Gintis and M. Osborne (2001), The Determinants of Earnings: A Behavioral Approach, Journal of Economic Literature, 39(4): 1137-1176.
Checchi, D. (1997), Education and Intergenerational Mobility in Occupations, American Journal of Economics and Sociology, 56(3): 331-352.
Durlauf, S. (2000), The Membership Theory of Poverty: The Role of Group Affiliations in Determining Socioeconomic Outcomes, mimeo, University of Wisconsin
Emran, M. Shahe and F. Shilpi (2012), Gender, Geography and Generations: Intergenerational Educational Mobility in Post-reform India, Policy Research Working Paper 6055.
Erikson, R. and J.H. Goldthorpe (1992), The Constant Flux: A Study of Class Mobility in Industrial Societies, Oxford: Clarendon Press.
———- (2002), Intergenerational Inequality: A Sociological Perspective, The Journal of Economic Perspectives, 16(3): 31-44, Summer.
Graham, J., A. Beller and P. Hernendez (1994), The Effects of Child Support on Educational Attainment, In Garfinkel, I., McLanahan, S. and Robins. P. (Eds.), Child Support and Child Well-Being, Washington, DC: The Urban Institute Press, pp. 317-354.
Hnatkovskay, V., A. Lahiri and S.B. Paul (2012), Breaking the Caste Barrier: Intergenerational Mobility in India, Unpublished Manuscript, University of British Columbia.
Jalan, J. and R. Murgai (2007), Intergenerational Mobility in Education in India, Processed, World Bank, Delhi.
Jodhpur Assembly Constituencies List, Vidhan Sabha Seats, http://elections.traceall.in/Jodhpur- district-assembly-constituencies-vidhan-sabha-seats-list
Jonsson, Jan O. (1989, 1993), Education, Social Mobility and Social Reproduction in Sweden: Patterns and Changes, in Hansen, Erik Jorgen, Stein Ringen, H. Uusitalo and R. Erikson (Ed.), Welfare Trends in the Scandinavian Countries, M.E. Shrape, Inc., New York, pp. 91-118.
Kapoor, Kranti and B.C. Mehta (1997), Education in India: Growth and Equity Aspects, Spellbound Publications, Rohtak, India.
Knoke, David and Peter Burke (1980), Log Linear Models, SAGE Publications.
Kumar, S., A. Heath and O. Heath (2002a), Determinants of Social Mobility in India, Economic and Political Weekly, 37(29): 2983–2987.
———- (2002b), Changing Patterns of Social Mobility: Some Trends over Time, Economic and Political Weekly, 37(40): 4091-4096.
Louw, Megan, Van Der Berg, Servaas and Yu, Derek (2006), Educational Attainment and Intergenerational Social Mobility in South Africa, Stellenbosch Economic Working Papers Number 09/06.
Mehta, B.C. (1993), A Note on Equity Aspects of Higher Education in Rajasthan, Journal of Higher Education, U.G.C., New Delhi, XVI(4): 581-592, Monsoon.
Mehta, K. and B.C. Mehta (1995), Education: Growth and Equity, Journal of Higher Education, New Delhi, 18(2): 269-281, Summer.
Rati, Ram (1990), Educational Expansion and Some Schooling Inequalities: International Evidence and Some Implications, Review of Economics and Statistics, 72(2): 266-274, May.
Upendranath, C. (1993), Structural Adjustment and Education: Issues Related to Equity, Economic and Political Weekly, 28(44): 2415-2419, Oct. 30.