The Analysis of Dynamic Relationship among Indian Sectoral Indices: Evidence from the ‘First 100 Days’ of Covid-19 Pandemic
March 2023 | Ruchita Verma and Janaki Singh Rathore
I Introduction
The historical trend shows that crisis in any particular industry might possess an inherent potential to elevate pessimism among all stakeholders, leading to higher volatility in the market, which in turns spills over to other industries and sectors as well as international financial markets in the form of global contagion (Dungey and Gajurel 2015). When it comes to dangerous and infectious diseases, the contagion effect can be expected on both, the main street as well as the wall street (Donadelli, Kizys, and Riedel 2017). In the recent past, SARS, Ebola, and H1N1 outbreaks wreaked relatively contained but intense damages on the stock markets of several countries. However, none are comparable to the Covid-19 pandemic in Ruchita Verma, Assistant Professor, Department of Financial Administration, Central University of Punjab, Bhatinda 151001, Punjab, Email: ruchitaverma.cup.edu.in
Janaki Singh Rathore, Assistant Professor, Hyderabad Business School, Gandhi Institute of Technology and Management, Hyderabad 502329, Telangana, Email: jrathore@gitam.edu janaki.rathore@yahoo.com
its reach, pace of spread, and potential to dismantle (completely or partially) the healthcare and financial systems of almost all the countries on the planet. Overpopulated countries like India, with major defects in their healthcare management policies are prone to the worst-case scenarios in this situation (SK 2020, Sarkar 2020). While medical research is on its rightful global focus, financial scholars and economists must also do their part to analyse the present and anticipate the future impact of the pandemic on every section of the Indian financial market. For the survival, recovery, and revival of the national economy, exploration and recommendations by the research community would be a potent weapon against the long-term financial impact of this pandemic.
In the context of the Covid-19 crisis, international implications are of secondary importance (Goyal 2020). The primary aim should be of assessing the present and impending damaging to different sectors within the economy, so that government can devise appropriate plans of their rehabilitation and market participants can manage their survival and growth. Logically, as with the relationships between different financial markets, the relations within a financial market can also be highly dynamic (Goodell 2020). Such relationships among the different sectors would change as the consequence of a global health crisis and must be analysed.
The present study investigates the dynamic relationships among the key sectoral indices of the Indian stock market. It has been conducted considering the recent shocks to national financial market, brought about by the Covid-19 pandemic. It determines the existence and changes in the nature of relationships among the seven selected indices. The study aims to highlight the importance of sector-focused assessment in designing investment portfolios for risk diversification, as well as building policy frameworks for managing economic response and recovery in times of crises. It attempts to answer the following research questions:
- Are the different sectoral indices cointegrated?
- In the short run, which indices have a tendency to lead (or lag) in comparison to other indices?
- Do these relationships change substantially during crisis periods?
This study provides an incremental contribution to the scant literature on the financial impact of pandemics in three major aspects. Firstly, it is conducted considering the health and emerging financial crisis caused by the Covid-19 pandemic. Secondly, only a few previous studies have explored the inter-sectoral relationships in the Indian market. Lastly, the findings from the study can be referred to for designing diversified portfolios and formulating policies to deal with any future crises caused by unforeseen events such as pandemics, terrorist attacks, etc.
The structure of the rest of the paper is as follows. Section II provides a review of the related literature for the study. Section III gives a description of sample
selections, sources of data, and the estimation methodology. Section IV presents the results of empirical analysis and findings and finally, Section V concludes the study along with implications.
II Review of Related Literature
From an extensive review of related literature, it is observed that there are many studies on the relationship among prices of difference stocks and commodities, macroeconomic variables such as inflation, GDP, and exchange rate, and their impact on the stock market indices. However, this collection becomes relatively small in the context of emerging markets (Gil-Alana and Yaya 2014, Bouria, Jain, Biswal, and Roubaud 2017).
Since, the Global Financial Crisis (GFC) of 2007-2008, researchers have recognized the importance of considering or allowing for the ‘crisis-fear’ effect or ‘crisis-opportunity’ effect while analysing financial markets. Almost all studies provide for the crisis effects to control for international volatility contagion during this specific period. Several researchers even proved that the relationship among international financial markets as well as indices within a national market altered significantly during and post the GFC (Ghosh and Kanjilal 2014). Interestingly, results during the crisis period were found to hint at the post-crisis relationships. There is ample evidence in the literature to prove that financial markets are highly dynamic and a global event such as the GFC bears enough influence to radically alter the interrelationships among its participants (Singh and Sharma 2018).
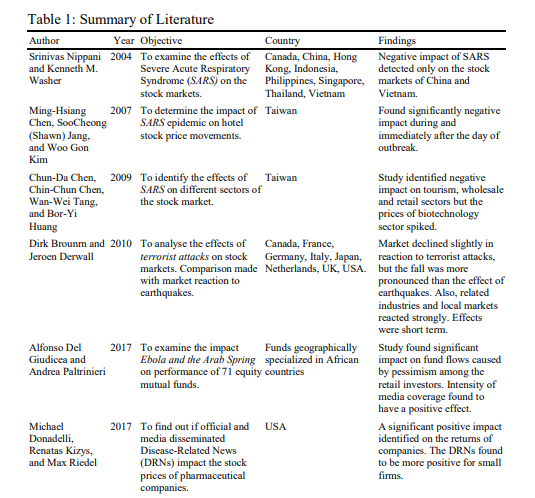
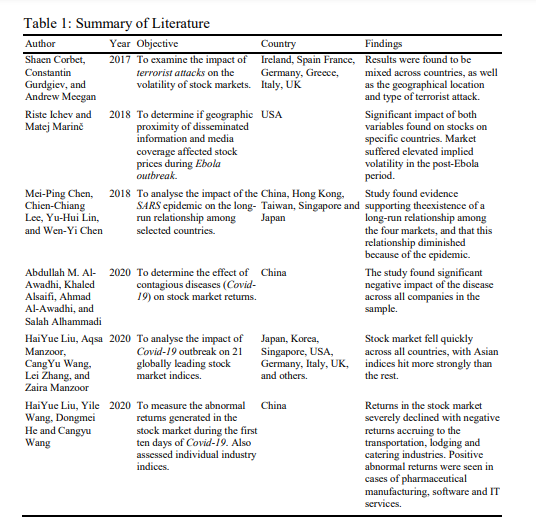
A recent article by Goodell (2020) motivated the present study by highlighting the potential effects of global crisis events on financial markets. He pointed out that literature in this field is ominously inadequate, and even more so in the context of unforeseen natural and man-made disasters that could trigger health and financial crises. Such events create and spread disruptions across the globe, even faster than a purely economic event. The survival and recovery measures by the governments as well as the corporate leaders also become considerably more complicated, and the markets grow volatile due to its sensitivity to investor mindset and emotions. As opposed to natural disasters which can be anticipated and prepared for using scientific instruments and methods, or purely financial downturns which spread and spillover at a relatively slower pace; unforeseen events such as terrorist attacks (sentiments of fear, anger and pessimism spread across countries almost instantly) and pandemics/epidemics are much more complicated to manage and to recover from. Hence, while analysing the financial effects of a global pandemic such as Covid-19, imperfect parallels can be drawn not just from studies on financial crises but also from those concerning terrorist attacks and past epidemics/pandemics. A few crucial studies are shown in Table 1.
In the context of emerging markets such as India; already dealing with overpopulation, religious turmoil, and inefficient healthcare system; international implications of global events are of secondary importance.
The primary aim should be of assessing the impact on different sectors within the economy (Goodell 2020). Logically, as with the relationships between different financial markets, the relations within a financial market can also be highly dynamic. Such relationships among the different sectors would change as a consequence of a global event and must be analysed. As per the knowledge of authors of the present study, very few researchers (Chesney, Reshetar, and Karaman 2011) have conducted such studies pertaining to the Indian financial market. Though the incremental contribution of such a study in survival and economic recovery policies is evident, the existing literature is scant, and results are mixed. The present study is unique in its aim to investigate the relationship among different sectoral indices in India, considering the health crisis and emerging financial downturn caused by the Covid-19 pandemic.
III Methodology
Sample Selection and Data Sources
The data for the study are the closing prices for seven National Stock Exchange (NSE) sectoral indices – NIFTY Bank (Banking), NIFTY Financial Services (Financial Market), NIFTY IT (Information Technology), NIFTY FMCG (Fast Moving Consumer Goods), NIFTY Metal (Metal and Mining), NIFTY Pharma (Pharmaceutical), and NIFTY Media (Media and Entertainment). Two samples of data comprising of 100 daily observations each are obtained from NSE historical prices database and subsequently transformed into their natural logarithms. The two samples pertain to the pre-pandemic1 (non-crisis) and pandemic (health and economic crisis) periods, and separate analyses are conducted for each sample.
The period of the first 100 days is selected to encompass the events of pandemic identification, informational and viral contagion, and early response of the market. Numerous studies in the fields of political (Keith 2017), management (Angwin 2004) and medical sciences (Weisman and Worden 1977) demonstrate the significance of this arbitrary but critical timeline in the assessment of preliminary preparedness, initial response, accelerated recovery and subsequent success, concerning a major change in the existing state of affairs of the system.
Estimation
The relationship between the selected sectoral indices can be examined for cointegration only if all the variables (transformed series of closing prices) are not stationary at level or trend. If they are not stationary at level (have a unit root), but stationary at first differences, there is a possible existence of cointegrating relationship which can be analysed. Next, the Granger causality can be employed to navigate direction of causation in the short run. The present study adopts the Johansen and Juselius (1990) cointegration approach to assess the changes in interrelationships among the different sectoral indices. Such examination might also be undertaken through the bivariate (Engle and Granger 1987) protocol. While the bivariate approach can be extended to adopt a multivariate framework, it falls inferior to the Johansen and Juselius (1990) technique in many ways (Chaudhuri 1997).
Test for Stationarity and Lag-Length Selection
As mentioned previously, variables integrated at different orders cannot be cointegrated. The stationarity of the selected variables is checked by Augmented Dickey-Fuller (ADF) test (Singh and Sharma 2018). The null hypothesis indicates the presence of unit root (non-stationarity). The aim is to ensure that any shocks observed in the values at level are only passing and will succumb to mean- reversion in the long run. The equation of ADF test regression can be given as follows:
| i=1 |
∆𝑌t = 𝛽1 + 𝛽2𝑡 + 𝛾𝑌t–1 + ∑m 𝛼i ∆𝑌t–1 + 𝜀t …(1)
Next, the multivariate Akaike’s Information Criterion (AIC) and the Schwartz Bayesian Criterion (SBC) are used for the selection of a suitable lag length which is neither too long (loss of degrees of freedom reduces power of the test), nor too short. Both criteria were developed to aid in maximum likelihood estimation techniques of cointegration analysis.
Cointegration
In the next step, provided that all the variables become stationary at first differences, presence of cointegrating relationship(s) among them can be examined using the Johansen and Juselius approach. It identifies if there are some stationary combinations of the non-stationary variable series, revealing the existence of a cointegrating relationship. It signifies a unique common trend among the variables, where they might not appear to be correlated in the short-run but converge to a long-run equilibrium. The equation of vector autoregressive model (kth order) cointegration test is as follows:
| i=1 |
∆𝑌t = 𝜇 + ∏ 𝑌t–1 + ∑k–1 ¬i 𝑌t–1 + 𝜀t …(2)
Trace and Maximum Eigenvalue statistics are utilised for determining the existence of cointegrating relationships among the variables. The values of the two statistics must be higher than the critical values, to support the existence of cointegration.
Granger Causality
Finally, the Granger causality test2 is employed to identify uni-directional and bi- directional relationship(s) among the variables. It also investigates the lead-lag relationship among the interrelated variables which can be utilised to make predictions concerning the lagging ones in the short run (Singh and Sharma, 2018). An illustrative bivariate vector autoregressive model (kth order) to conduct the test of granger causality is given in equation (3) and (4). The equations are illustrative as a total of 42 null hypotheses (for seven variables) are tested in the present study.
| i=1 |
𝑌t = 𝛼0 + ∑k
| i=1 |
𝑋t = 𝛿0 + ∑k
𝛼i 𝑌t–i + ∑k
| j=1 |
| j=1 |
𝛿i 𝑋t–i + ∑k
𝛽j 𝑋t–j + 𝜖t …(3)
𝛽𝛾j 𝑌t–j + 𝜖′t …(4)
For Equation (3), null hypothesis: 𝑋t does not Granger cause 𝑌t. If rejected, lead-lag relationship exists from X to Y. Similarly, for Equation (4), null hypothesis: 𝑌t does not Granger cause 𝑋t. If rejected, lead-lag relationship exists from Y to X. If both hypotheses are rejected, bi-directional relationship exists. Existence of cointegration provides a preliminary evidence of causality (granger) in at least one direction.
II Empirical Results and Findings of the Study
This section presents the results of empirical analysis and the inferred findings. It is divided into four sub-sections. The first part provides a descriptive summary
and correlation matrix of the selected variables. The second part tests the stationarity of the series using ADF test and determines the optimal lag-length for further analysis. Cointegration analysis is conducted in the third part and finally, short-run causality and lead-lag relationships are assessed in the fourth part.
Summary Statistics
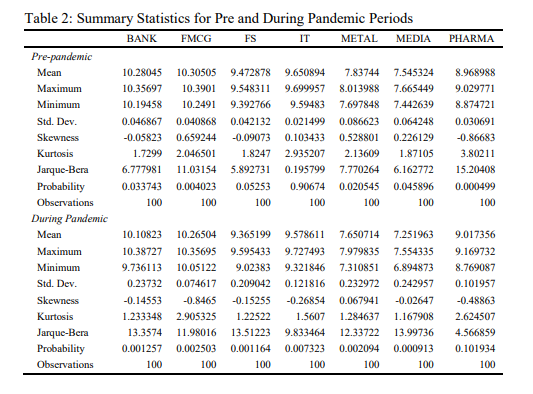
Summary statistics of return series are computed for the pre-pandemic and the pandemic periods for the seven sectoral indices. Table 2 indicates a marginal fall in average value of NIFTY Bank from 10.28045 in the pre-pandemic period to 10.10823 in the pandemic period, further magnified by much wider variations in relative standard deviations across the samples. This depicts the rise in volatility of NIFTY FMCG, NIFTY Financial Services, NIFTY IT, NIFTY Metal, NIFTY Media, and NIFTY pharma in the pandemic period. The distribution of the variable series is examined using Jarque-Bera probability test. The results revealed that except for NIFTY IT (pre-pandemic) and NIFTY Pharma (pandemic), all other variables are not normally distributed.
ADF Test for Unit Root
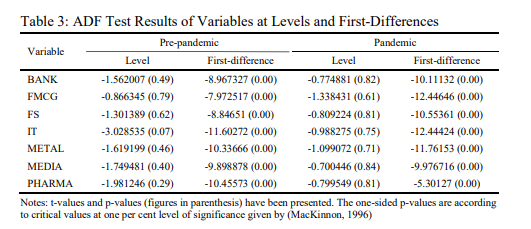
The results of ADF test for unit root are given in Table 3. It can be observed that all the series are non-stationary at their levels in pre and during-pandemic periods, and stationary at first-differences across both the sub-periods. Hence, it can be concluded that the series are integrated at the first order, which gives the values of return series.
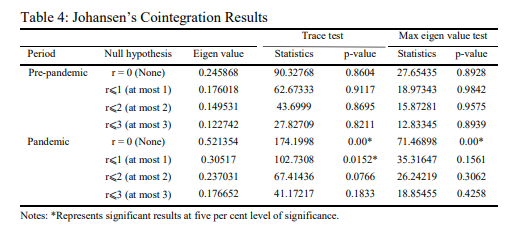
Johansen’s Cointegration Analysis
The ADF unit root test results, indicated in the previous sub-section, support the applicability of Johansen’s cointegration test on all the seven variables’ series. The size of ideal lag length is determined on basis of the SBC and the AIC criteria. As per AIC values, the lag length is indicated as 2 and 3 in the pre-pandemic period and during the pandemic period, respectively. SBC gives the optimal lag length as 1 and 2 for the pre and during pandemic periods, respectively. In cases of such inconsistency, AIC criterion is generally considered preferable (Vrieze, 2012). From Table 4, it can be observed that the seven variables have no cointegrating relation in the pre-pandemic period. During the pandemic, the results of the trace test suggests two cointegrating relationships, at 5 percent level of significance. The results of cointegration test thus determines the existence of a long-run equilibrium among the key sectoral indices of NSE during the pandemic period but not in the immediately preceding period. Thus, the present study provides evidence of a dynamic relationship among the selected indices, intensified during periods of crisis. The findings for the crisis (here, pandemic) and non-crisis (here, pre- pandemic) periods are in congruence with the results reported by several researchers studying the impact of Global Financial Crisis (GFC) on markets.
Granger Causality Results
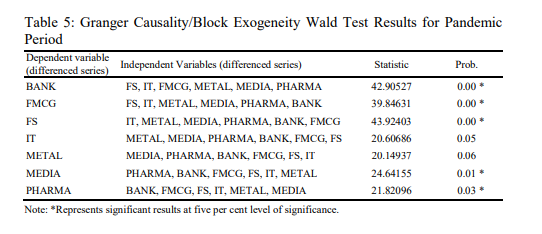
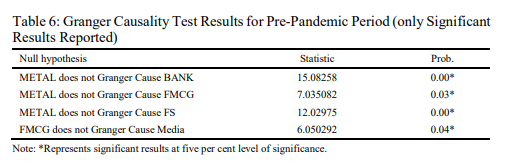
To determine the short-run causality among the cointegrated variables, Table 5 depicts the results of Granger causality/block exogeneity Wald test for the pandemic period (Singh and Sharma 2018). The existence of short-run causality relationship is reported for NIFTY Bank, NIFTY FMCG, NIFTY Financial Services, NIFTY Pharma, and NIFTY Media in the pandemic crisis period. Each of these five variables is influenced by at least one (up to three) other variable/s. During the pandemic period, NIFTY IT and NIFTY Metal are influenced by themselves only. In Table 6, concerning the pre-pandemic period, Granger test results show that there is one-way causality running from FMCG to Media and from Metal to Bank, FMCG and Financial Services.
From the above analysis, it can be inferred that the relationship among key sectoral indices is dynamic across the two sub-periods, pre-pandemic and pandemic. These variables display a cointegrating relationship only in the pandemic period. Also, in the short run, no consistent relationships or lead-lag behaviour that remains pervasive across the sub-periods can be identified. However, NIFTY Metal and NIFTY FMCG are found to granger cause several other indices in the pre-pandemic period, and could regain their positions in the post-pandemic time. During the period of crisis caused due to the pandemic, NIFTY IT, NIFTY FMCG, NIFTY Media and NIFTY Pharma emerged as the most leading indices on the NSE.
V Conclusion
In the pre-pandemic period, no cointegrating relationship could be identified among the selected indices. Additionally, the results showed very weak evidence of Granger causality among the indices, thus revealing considerable opportunities for investment strategies aiming at portfolio diversification, but models for future predictions of a sectoral index could not be formulated on the basis of past returns of other indices. Out of the 42 pairs of possible pairwise-combinations, only four showed uni-directional granger causality, mooting the opportunity to employ lead- lag relationships among indices to make short-run predictions in the stock market. NIFTY Metal was found to have a relatively dominant role in the market and could be utilised to anticipate short-run changes in Bank, FMCG, and Financial Services indices. The lagged values of FMCG index were also found to granger cause Media index.
However, during the sample period of pandemic, the multivariate cointegration analysis revealed the existence of two cointegrating equations. Thus, it can be inferred that the seven indices share cointegrating relationship, and information from past performance of other indices could be utilised to predict future fluctuations in prices of the market. The results provide evidence against investment strategies that encourage longer holding periods for extraordinary gains during times of crisis. Earnings for such investors could be moderate at best. During the period of crisis caused due to the pandemic, NIFTY IT, NIFTY FMCG, NIFTY Media and NIFTY Pharma emerged as the most leading indices on the
NSE. Thus, the crisis period enabled a comparatively higher number of short-run relationships among the NSE indices.
The findings of the present study have implications for investors and policy makers alike. It provides empirical evidence in favour of sector-focused investment management and policy development in general and highlights its importance during periods of crisis in particular. The results determine existence of dynamic relationships, causality linkages and identify leading indices of sector co-movements in the Indian stock market.
Endnotes
- Cut-off date of the two samples considered to be 31st December, 2019 as per (Novel Coronavirus (2019-nCoV), 2020)
- Refer (Granger 1969)
References
Al-Awadhi, A.M., K. Alsaifi, A. Al-Awadhi and S. Alhammadi (2020), Death and Contagious Infectious Diseases: Impact of the COVID-19, Journal of Behavioral and Experimental Finance, 27, No. 100326, September, doi:10.1016/j.jbef.2020.100326
Angwin, D. (2004), Speed in M&A Integration: The First 100 Days, European Management Journal,
22(4): 418-430, doi:10.1016/j.emj.2004.06.005
Bouria, E., A. Jain, P. Biswal and D. Roubaud (2017), Cointegration and Nonlinear Causality amongst Gold, Oil, and the Indian Stock Market: Evidence from Implied Volatility Indices, Resources Policy, 52(6): 201-206, doi:10.1016/j.resourpol.2017.03.003
Brounrn, D. and J. Derwall (2010), The Impact of Terrorist Attacks, European Financial Management, 16(4): 585-598, doi:10.1111/j.1468-036X.2009.00502.x
Chaudhuri, K. (1997), Cointegraton, Error Correction and Granger Causality: An Application with Latin American Stock Markets, Applied Economics Letters, 4(8): 469-471, doi:10.1080/ 758536627
Chen, M.-P., C.-C. Lee, Y.-H. Lin, and W.-Y. Chen (2018), Did the S.A.R.S. Epidemic Weaken the Integration of Asian Stock Markets? Evidence from Smooth Time-Varying Cointegration Analysis, Economic Research-Ekonomska Istraživanja, 31(1): 908-926, doi:10.1080/ 1331677X.2018.1456354
Chena, M.-H., S. Jangb and W.G. Kim (2007), The Impact of the SARS Outbreak on Taiwanese Hotel Stock Performance: An Event-Study Approach, Hospitality Management, 26(1): 200-212, doi:10.1016/j.ijhm.2005.11.004
Chesney, M., G. Reshetar and M. Karaman (2011), The Impact of Terrorism on Financial Markets: An Empirical Study, Journal of Banking and Finance, 35(2): 253-267, doi:10.1016/j.jbankfin. 2010.07.026
Chun-Da Chen, C.-C. C.-W.-Y. (2009), The Positive and Negative Impacts of the Sars Outbreak: A Case of the Taiwan, The Journal of Developing Areas, 43(1): 298-293, Retrieved from http://www.jstor.com/stable/40376284
Corbet, S., C. Gurdgiev and A. Meegan (2018), Long-Term Stock Market Volatility and the Influence of Terrorist Attacks in Europe, The Quaterly Review of Economics and Finance, 68(2): 118-131, doi:10.1016/j.qref.2017.11.012
Donadelli, M., R. Kizys and M. Riedel (2017), Dangerous Infectious Diseases: Bad News for Main Street, Good news for Wall Street?, Journal of Financial Markets, 35(4): 84-103, doi:10.1016/j.finmar.2016.12.003
Dungey, M. and D. Gajurel (2015), Contagion and Banking Crisis – International Evidence for 2007– 2009, Journal of Banking and Finance, 60(11): 271-283, doi:10.1016/j.jbankfin.2015.08.007 Engle, R.F. and C.W. Granger (1987), Co-Integration and Error Correction: Representation, Estimation, and Testing, Econometrica: Journal of the Econometric Society, 55(2): 251-276,
doi:10.2307/1913236
Ghosh, S. and K. Kanjilal (2014), Co-Movement of International Crude Oil Price and IndianS: Evidences from Nonlinear Cointegration Tests, Energy Economics, 53(1): 111-117, doi:10.1016/j.eneco.2014.11.002
Gil-Alana, L.A. and O.S. Yaya (2014), The Relationship between Oil Prices and the Nigerian Stock Market, An Analysis based on Fractional Integration and Cointegration, Energy Economics, 46(7): 328-333, doi:10.1016/j.eneco.2014.10.001
Giudice, A.D. and A. Paltrinieri (2017), The Impact of the Arab Spring and the Ebola Outbreak on African Equity Mutual Fund Investor Decisions, Research in International Business and Finance, 41(4): 600-612, doi:10.1016/j.ribaf.2017.05.004
Goodell, J.W. (2020), COVID-19 and Finance: Agendas for Future Research, Finance Reserach Letters, 35(4): 101512, doi:10.1016/j.frl.2020.101512
Goyal, G. (2020), Vocal for Local: PM Narendra Modi’s big boost to Indian companies, Retrieved from Economic Times, May 19, https://cfo.economictimes.indiatimes.com/news/big-boost- for-indian-companies-as-pm-narendra-modi-promotes-local/75797193
Ichev, R. and M. Marinč (2018), Stock Prices and Geographic Proximity of Information: Evidence from the Ebola Outbreak, International Review of Financial Analysis, 56(2): 153-166, doi:10.1016/j.irfa.2017.12.004
Keith, T. (2017), The First 100 Days: A Standard That Not Even Roosevelt Achieved, Retrieved from npr, April 29, https://www.npr.org/2017/04/29/525810758/the-first-100-days-a-standard-that- not-even-roosevelt-achieved
Liu, H., A. Manzoor, C. Wang, L. Zhang and Z. Manzoor (2020), The COVID-19 Outbreak and Affected Countries Stock Market Response, International Journal of Environmental Research and Public Health, 17(8): 2800, doi:10.3390/ijerph17082800
Liu, H., Y. Wang, D. He, and C. Wang (2020), Short Term Response of Chinese Stock Markets to the Outbreak of COVID-19, Applied Economics, 52(53): 5859-5872, doi:10.1080/00036846
.2020.1776837
MacKinnon, J.G. (1996), Numerical Distribution Functions for Unit Root and Cointegration Tests, Journal of Applied Econometrics, 11(6): 601-618, doi:10.1002/(SICI)1099-1255(199611)11: 6<601::AID-JAE417>3.0.CO;2-T
Nippani, S. and K.M. Washer (2004), SARS: A Non-Event for Affected Countries’ Stock Markets,
Applied Financial Economics, 14(15): 1105-1110, doi:10.1080/0960310042000310579 Sarkar, S. (2020), Analysts Lower Targets for 90% of Indian Stocks Amid Covid-19 Crisis, Retrieved
from Bloomberg Quint, April 15, https://www.bloombergquint.com/markets/analysts-lower- targets-for-90-of-indian-stocks-amid-covid-19-crisis
Singh, N.P. and S. Sharma (2018), Phase-Wise Analysis of Dynamic Relationship among Gold, Crude Oil, US Dollar and Stock Market, Journal of Advances in Management Research, 15(4): 480-499, doi:10.1108/JAMR-12-2017-0124
SK, L. (2020), Big Story: How Covid-19 Changes the Outlook for Economy and Stock Market, Retrieved from The Hindu Businessline, April 4, https://www.thehindubusinessline.com/ portfolio/big-story/how-covid-19-changes-the-outlook-for-economy-and-stock- market/article31256781.ece
Vrieze, S.I. (2012), Model Selection and Psychological Theory: A Discussion of the Differences between the Akaike Information Criterion (AIC) and the Bayesian Information Criterion (BIC), Psychological Methods, 17(2): 228, doi:10.1037/a0027127
Weisman, A.D. and J.W. Worden (1977), The Existential Plight in Cancer: Significance of the First 100 Days, International Journal of Psychiatry in Medicine, 7(1): 1-15, doi:10.2190/UQ2G- UGV1-3PPC-6387