The Role of Tertiary Education and Good Health in Determining Female Labour Participation in India
March 2023 | Parwinder Kaur and Suraj Sharma
I Introduction
Women constitute slightly more than half of the global population, but their contribution to planned economic growth and development is less than their capacity (Bills 2018). Women currently account for roughly 46 per cent of the global labour force (World Bank 2020). However, women’s labour-force participation in most countries is significantly lower than men’s labour-force. The rate of women’s wage labour growth was a topic of discussion among emerging economists all over the world. A glance at the global trend reveals that there are differences in the extent to which females have access to the labour market (Verick 2018). The gender participation gap is wider in developing countries than in developed countries (International Labour Organization) (ILO 2016). Female Labour Participation (FLP) is critical for a country’s social and economic growth because it promotes productivity and justice.
labour-force participation usually entails an improvement in their economic and social status, as well as their emancipation. In the case of developing countries, this not only alleviates poverty but also reduces the impact of various shocks (Verick 2018). Despite the fact that the world hopes to have no gender-based dichotomy by 2018, gender-based difference is still a reality. The world is moving closer to full-fledged gender equality and women’s empowerment; however, women continue to face discrimination in many parts of the world (United Nations Women 2018). The Sustainable Development Goals (SDGs) are critical to achieving previous millennium goals (Le Blanc 2015).
Gender equality is a human right as well as a necessary component of creating a prosperous, equal, and sustainable world. As a result, sustainable development and gender equality are inextricably linked and mentioned as “leave no one behind” strategy, which emphasizes the importance of women’s participation in economic development (Esquivel and Sweet Man 2016). The 2030 Sustainable Development Agenda not only aims to eliminate this discrimination, but also to priorities women-centric growth as a means of achieving long-term development (Rosche 2016). According to the United Nations Women (2018), there can never be sustainable development if women are mistreated and abused.
Earlier studies have acknowledged that women’s overall conditions and status have improved over the decades and add that the government and other institutions are also interfering to increase female participation in education and training, as well as access to better health and living standards (Becker 1994, Denison 1985, Guilloches and Mason 1972, Huq, CluniesRoss, and Mincer 1974). As a result, Nussbaum (2003) believes that this should result in increased female employment opportunities.
The importance and impact of education on the participation of both men and women in the labour force is widely acknowledged (Cameron, et. al. 2001). Several studies have found that educational attainment is a persistent and significant determinant of labour-force participation in both developing and underdeveloped countries.
In a cross-sectional data set, Sudarshan (2014) found there is a U-shaped correlation between education system and female labour force participation, with innumerate and university educated women having the highest levels of participation. Nwosu and Woolard (2017) found positive and significant impact of self-reporting outstanding, very good, or good health (as opposed to fair or poor health) on labour participation. The effect is found to be more noticeable in men than in women. Along with a decrease in mortality, the population has seen a significant increase in educational attainment (Lutz, et. al. 2014).
Using the reasoning given above, the purpose of this research is to determine the relationship between the female tertiary education, female life expectancy, consumer price index, gross value-added, and female labour force participation in India. Previous research has looked into the association between education and labour force participation extensively; however, the author is unaware of any research that has looked into the relationship between tertiary education and
female labour participation using life expectancy, price level and economic growth as other explanatory variables. Furthermore, it serves as a research contribution to the economic model based on the factors listed.
India was chosen for this study because of the obvious improvements in female schooling and health data, but also because of the rising rate of unemployment, particularly among youth and females. The purpose of this research is to determine whether or not sustainable development has aided India. The research is divided into five sections. The second section of the study provides a brief overview of female labour force participation in India, the third examines empirical methods, the fourth examines empirical analysis of data, and the final fifth section discusses conclusions and policy implications.
II Female Labour Force Participation in India
India is the most populous country, with a population of approximately 1366.4 million people. The population is expected to grow from 1388.4 million in 2020 to 1639.1 million in 2050. India is also expected to overtake China as the world’s most populous country by 2050 (World Meter 2020). Unfortunately, approximately 103,137,054 people are currently living below the poverty line (World Poverty Clock 2020). Among emerging markets and developed countries, India has one of the lowest percentages of Female Labour Force Participation (FLFP) – usually defined as the percentage of women employed or seeking employment as part of the working-age female population (World Bank 2016, Bills 2018).
India’s GDP increased from 320.97 billion US dollars to 2.83 trillion US dollars between 1990 and 2019, but the FLFP fell from around 30.2 per cent to 20.3 per cent (World Bank 2020). India is unusual, but not unique, in having lower labour-force participation rates among adult women with a secondary education. Only 14 countries have lower rates of labour force participation for adult women with secondary education than for women with less than primary school completion in the 71 countries with appropriate census data in the IPUMS-I data archive (Minnesota Population Centre 2017). Only Rwanda has a greater disparity (19 per cent vs. 35 per cent) than India (72 per cent vs. 92 per cent). However, several other countries have lower labour force participation rates for secondary educated women (e.g., Indonesia, 47 per cent vs. 63 per cent; Turkey, 34 per cent vs. 46 per cent; and Ghana, 76 per cent vs. 84 per cent (Chatterjee, et. al. 2018). Increasing longevity and declining labour-to-worker ratios are two of the developing world’s major demographic threats. Acting later on could be a cure. However, nothing is known about the distribution of increased lifespan between jobs and retirement (Myrskyla, et. al. 2013). Female life expectancy was 59.6 years in 1990 and 71.6 years in 2020. In terms of life expectancy, India ranked 136th out of 196 countries (World Meter 2020).
According to the global gender gap report, India ranks 149th out of 153 countries in terms of economic participation, with a score of 0.354. With a score of 0.962, India ranked 112 in educational attainment. India ranks 150th in health and survival, with a score of 0.944, and 18th in political representation, with a score of 0.411. Women’s labour-force participation is an important driver and effect of growth and progress, especially in light of the international context and recognition of the Millennium and Sustainable Development Goals for women’s education. Despite the fact that the representation of women in jobs continues to rise in tandem with economic growth, female labour-force participation has been declining. In 2020, the female labour force participation rate was at its lowest in the last 20 years, at 20.3 per cent.
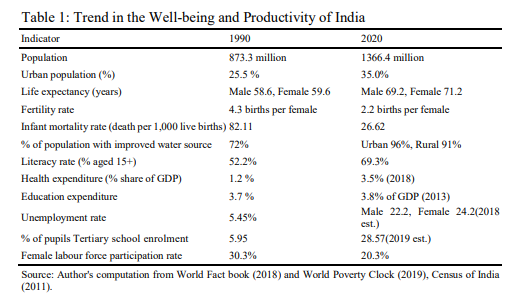
Table 1 shows that women’s lives have changed significantly since the situation a few decades ago. In the field of gender representation in education, progress has been made. Although there has been progress in the performance of health facilities, the female labour force participation rate in India has been declining.
II Data and Methodology
This study made use of time series data from 1990 to 2019. These 28 years of data were chosen to investigate in depth, the relationship between women’s labour participation rate, tertiary education, and life expectancy of females. The World Development Indicators (WDI) are the primary data collection source. It is the World Bank’s first international collection of sustainable growth figures derived from publicly available documents. The WDI incorporates domestic, regional and global projections and provides data for 217 economies with access to over 1600 metrics. In general, the WDI discusses poverty, health, population data,
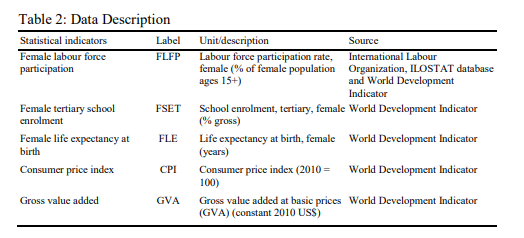
commerce, environment, etc. This demonstrates that WDI is the most reliable data source. The variables used in this study are described in Table 2.
Model Specification
The model constructed for this study is modelled after the work of Klasen and Lamanna (2009). Equation (1) is the functional form of the model, whereas Equation (2) is the model in its econometric form.
𝐹𝐿𝐹𝑃 = 𝑓(𝐹𝑆𝐸𝑇, 𝐹𝐿𝐸, 𝐶𝑃𝐼, 𝐺𝑉𝐴) …(1)
𝐹𝐿𝐹𝑃t = 𝛼 + 𝛽1𝐹𝑆𝐸𝑇t + 𝛽2𝐹𝐿𝐸t + 𝛽3𝐶𝑃𝐼t + 𝛽4𝐺𝑉𝐴t + 𝜀t …(2)
Where α represents the model intercept and β1, β2, β3 andβ4 are the coefficients for the repressors; Female School Enrolment in Tertiary (FSET), Female Life Expectancy (FLE) Consumer Price Index (CPI) and Gross Value Added (GVA). Female Labour Force Participation (FLFP) is the dependent variable.
Stationary Tests
To prevent inappropriate conclusions and policy implications as a result of spurious regression, the stationary properties of the variables employed in the study are investigated. The augmented Dickey–Fuller and Phillip–Perron tests are employed.
VAR Model Estimate
A multivariate VAR model with log transformed is shown as:
| i=1 |
| n=1 |
| p=1 |
𝐿𝑁𝐹𝐿𝐹𝑃t = 𝜎 + ∑k
𝛽i𝐿𝑁𝐹𝐿𝐹𝑃t–i + ∑k
𝜙j𝐿𝑁𝐹𝑆𝐸𝑇t–j +
| j=1 |
| ∑ |
k m=1
𝜑m𝐿𝑁𝐹𝐿𝐸t–m + ∑k
𝜂n𝐿𝑁𝐶𝑃𝐼t–n + ∑k
𝜆p𝐿𝑁𝐺𝑉𝐴t–p + 𝜐1t …(3)
Here we show only one system equation for convenience which shows that on L.H.S. log of Female labour force participation i.e., the dependent variable, is a function of its own lag and the lagged values of order regressors in the system.
II Empirical Analysis and Results
Visual inspection is important in time series research for preliminary examination. Appendix A contains visual inspections of the variables used in the analysis (see Figure 1). The graphical study shows a downward trend in female labour force participation and an upward trend in life expectancy, consumer price index, gross value added, and tertiary education over time, which reflects major economic and political developments in India. However, declining female labour force participation is a cause for concern in India.
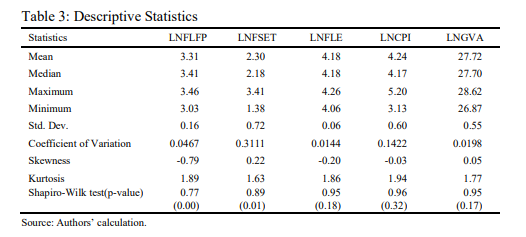
Table 3 shows a straightforward descriptive statistical analysis. Female Labour Force Participation (FLFP), Female Life Expectancy (FLE), and Gross Value Added (GVA) have low variability when compared to Female School Enrolment in Tertiary Education (FSET) and Consumer Price Index (CPI) for India from 1990 to 2019. Female life expectancy (1.4 per cent) has the lowest variability, while female school enrolment in tertiary education (31.1 per cent) has the highest variability for the sample period. It is clear from the skewness values that none of them are greater than +1 or less than -1, indicating that none of our variables of interest have a significantly skewed distribution. Except for female labour force participation and the consumer price index, all of the variables observed are positively skewed. Kurtosis values greater than one, on the other hand, indicate peaked distributions.
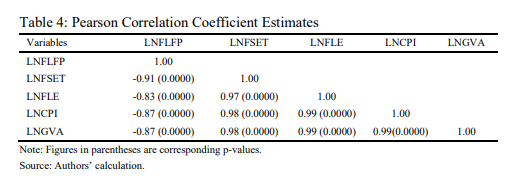
The investigation quickly revealed the correlation between all of the parameters utilized in the study to investigate the relationship between female enrolment in tertiary education, life expectancy, consumer price index, gross value added and labour force participation rate in India and is shown in Table 4. The Pearson correlation coefficients for the factors under consideration provide useful information about the essence of the parameters’ associations. The findings indicate a statistically significant inverse relationship between FLFP and all other variables studied. Female enrolments in tertiary education and female labour-force participation have a statistically significant negative relationship. Furthermore, the presence of correlations is insufficient to validate the observed relationships. As a result, more econometric analyses are needed.
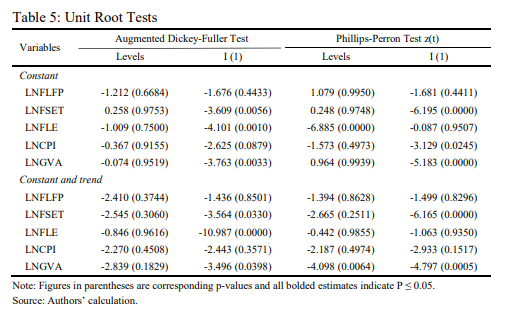
Table 5 displays the results of the stationary test, which is required before delving deeper into the time series data. In this analysis, we used augmented Dickey Fuller and Phillips Perron tests to validate the absence or presence of a unit root in the series. For precise estimations, we estimated both constant and trend coefficients. The insignificant ADF coefficients of FLFP show that the criterion variable has a unit root at both level and 1st difference. The PP test backs up the argument. Female School Enrolment in Tertiary Education (FSET) is discovered to be of order one. Using the ADF and PP tests, the Female Life Expectancy (FLE) and Consumer Price Index (CPI) series produce mixed results, while the Gross Value Added (GVA) series is found to be integrated of order one.
The stationary tests show that we cannot use Vector Error Correction (VEC) or Auto-Regressive Distributed Lag (ARDL) because our variables of interest are integrated at different orders, and the criterion variable, FLFP, is neither integrated at zero nor integrated at one. The findings compel us to employ a vector autoregressive model to capture the relationship between female labour supply and enrolment in tertiary education for females, as well as female life expectancy, in a multivariate time series framework that includes variables such as the consumer price index and gross value added for India from 1990 to 2019.
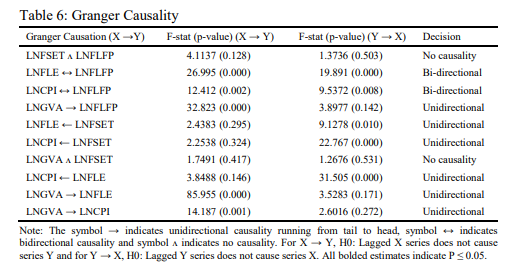
It is critical to use the Granger causality test to confirm the causality between variables of interest, as shown in Table 6. The Granger causality test is used to investigate the causal relationship between variables. Female Life Expectancy (FLE), Consumer Price Index (CPI), and Gross Value Added (GVA) all have a strong influence on Female Labour Force Participation (FLFP), but Tertiary School Enrolment for Females (FSET) does not We find bidirectional causality between FLE and FLFP as well as CPI and FLFP, unidirectional causality between GVA and FLFP, and no causality between FSET and FLFP. Female Tertiary School Enrolment (FSET) Granger causes FLE and CPI, and FLE and CPI ultimately Granger cause FLFP. Therefore, it can be inferred that FSET indirectly influences FLFP. Furthermore, unidirectional causality runs from FLE to CPI, GVA to FLE, and GVA to CPI.
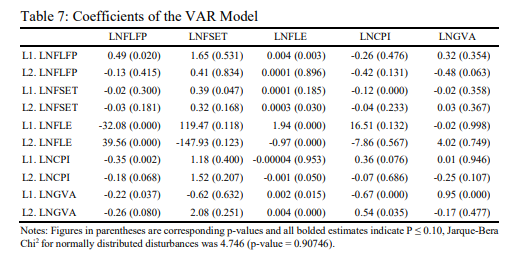
A basic VAR model was estimated in a multivariate framework to fit a VAR model, as shown in Table 7. The model’s order with lag 2 was determined using the BIC criterion. Each column contains an outcome variable as well as the lagged regressors. We concentrate on the FLFP equation; it is clear that the first and second lags of FSET have no effect on FLFP; however, the coefficients have negative signs, indicating a negative impact. The first lag of FLE has a negative impact on FLFP while the second lag of FLE has a positive impact on FLFP at a significant level of 1.0 per cent on average ceteris paribus, indicating that increasing FLE decreases FLFP in the early stages but has a positive impact on FLFP in the later stages.
Increasing general prices have a negative impact on female labour supply, as shown in Table 7 where the first and second lags of CPI have a significant negative impact on FLFP at 1.0 per cent and 10.0 per cent on average ceteris paribus. Table 7 shows that the first and second lags of GVA have a negative impact on FLFP at a significant level of 5.0 per cent and 10.0 per cent, respectively, on average ceteris paribus.
II Conclusion and Policy Implications
This study examines the impact of tertiary education, life expectancy, the consumer price index, and gross value added on Indian women’s participation in the labour force. Utilizing current and accurate econometric methods, statistical facts are extracted from annual databases spanning the years 1990 to 2019.
Tertiary education has no direct significant impact on FLFP in India, according to the findings of the vector autoregressive model, however gross value added and the consumer price index have a negative impact on FLFP. Female life expectancy has a negative impact on FLFP at first, but it later has a beneficial impact. Policymakers are urged to make a concerted effort to align with the United Nations’ Sustainable Development Goals. This is a clarion call to Indian government officials and politicians to behave more pragmatically in order to limit or eradicate the gender disparity in labour force participation. As observed by this report, there is a need to boost macroeconomic practices in a way that promotes girl and woman empowerment, as this will transform into greater female labour force participation Indian policymakers are urged to actively comply towards gender related guidelines provided by international organizations such as the International Labour Organization and the United Nations Educational, Scientific, and Cultural Organization. The corporate sector of the economy assistance is also needed in developing a gender friendly workplace culture, which would trigger more female labour force participation, considering their historically measurable contribution on national output—especially in less developed countries, where women representation in national productivity is severely lacking.
Reference
Becker, G.S. (1994), Human Capital Revisited, In Human Capital: A Theoretical and Empirical Analysis with Special Reference to Education (3rdEd.), pp. 15–28, Chicago, Illinois, United States: The University of Chicago Press.
———- (2009), Human Capital: A Theoretical and Empirical Analysis, with Special Reference to Education, University of Chicago press.
Bills, Consuelo Alina (2018), Female Labor Force Participation and Tertiary Education: A Case Study of India and Brazil.
Bussmann, Margit (2009), The Effect of Trade Openness on Women’s Welfare and Work Life,
World Development, 37(6): 1027-1038.
Cameron, L.A., J. Malcolm Dowling and C. Worswick (2001), Education and Labor Market Participation of Women in Asia: Evidence from Five Countries, Economic Development and Cultural Change, 49(3): 459-477.
Chatterjee, E., S. Desai and R. Vanneman (2018), Indian Paradox: Rising Education, Declining Women’s Employment, Demographic Research, 38: 855–878.
Cuberes, D. and M. Teignier (2014), Gender Inequality and Economic Growth: A Critical Review, Journal of International Development, 26(2): 260-276.
Denison, E.F. (1985), Trends in American Economic Growth, 1929–1982, Washington DC: The Brookings Institute.
Esquivel, V. and C. Sweetman (2016), Gender and the Sustainable Development Goals, Gender and Development, 24(1): 1–8, https://doi.org/ 10.1080/13552074.2016.1153318
Gaddis, I. and J. Pieters (2012), Trade Liberalization and Female Labor Force Participation: Evidence from Brazil.
Granger, C.W.J (1969), Investigating Causal Relations by Econometric Models and Cross Spectral Methods, Econometrica, 37(3): 424-438.
Griliches, Z. and W.M. Mason (1972), Education, Income, and Ability, Journal of Political Economy, 80(3, Part 2): S74-S103.
Hadley, L. (1982), A Microeconomic Analysis of Labor Supply Incorporating the Price Level as an Independent Variable, Nebraska Journal of Economics and Business, 21(3): 4-14, https://worldpoverty.io/map
Huq, M.M., A. Clunies‐Ross and D. Forsyth (2009), Development Economics, New York, United States: McGraw Hill.
International Labour Organization (ILO) (2016), Women at Work: Trends 2016, Geneva, Switzerland: International Labour Organization, Retrieved from https://www.ilo.org (Access date: 28/11/2018).
Le Blanc, D. (2015), Towards Integration at Last? The Sustainable Development Goals as a Network of Targets, Sustainable Development, 23(3): 176-187.
Lutz, W., W.P. Butz and S. KC (2014a), World Population and Human Capital in the Twenty-First Century, Oxford: Oxford University Press.
Myrskylä, M., T. Leinonen and P. Martikainen (2013), Life Expectancy by Labor Force Status and Social Class: Recent Period and Cohort Trends and Projections for Finland.
Niemi, B.T. and C.B. Lloyd (1981), Female Labor Supply in the Context of Inflation, The American Economic Review, 71(2): 70-75.
Nwosu, C.O. and I. Woolard (2017), The Impact of Health on Labour Force Participation in South Africa, South African Journal of Economics, 85(4): 481-490.
Pietschmann, I., S. Kapsos, E. Bourmpoula, Z. Sajaia and M. Lokshin (2016), Key Labor Market Indicators: Analysis with Household Survey Data, World Bank Publications.
Planning Commission of India (n.d.), Health and Family Welfare and AYUSH: 11th Five Year Plan (PDF), Retrieved 19 September 2010. p. 78
Rosche, D. (2016), Agenda 2030 and the Sustainable Development Goals: Gender Equality at Last? An Oxfam Perspective, Gender and Development, 24(1): 111–126, https://doi.org/10.1080/ 13552074.
Schaner, S. and S. Das (2016), Female Labor Force Participation in Asia: Indonesia Country Study, Asian Development Bank Economics Working Paper Series (474).
Sudarshan, R.M. (2014), ILO Asia-Pacific Working Paper Series.
Uduji, J.I., E.N. Okolo-Obasi and S.A. Asongu (2019), Responsible Use of Crop Protection Products and Nigeria’s Growth Enhancement Support Scheme, Development in Practice, 29(4): 448-463.
UN Women (2018), Turning Promises into Action: Gender Equality in the 2030 Agenda for Sustainable Development, Retrieved from http://www.unwomen.org/‐/media/headquarters/ attachments/sections/library/publications/2018/sdg‐report‐fact‐sheet‐sub‐saharan‐africa‐ en.pdf?la=en&vs=3558 (Access date 20/02/2019).
Verick, S. (2018), Female Labor Force Participation and Development, IZA World of Labor. World Bank (2020), Labor Force, Female (% of total labor force), World Develop Indicator,
Retrieved from https://databank.worldbank.org/source/world-development-indicators
World Meter (2020), Retrieved from (www.worldometers.info)
World Poverty Clock (2020), Retrieved from https://worldpoverty.io/headline