Health Shocks and Vulnerability to Poverty in India
September 2023 | Priyanka Dasgupta and Subrata Mukherjee
I Introduction
Any illness or injury weakens the health status of household member(s) and generates a welfare loss for households (Dhanaraj 2016). Presence of any member with illness/injury might result in hospitalisation or death of the member in future. This can lead to limited ability to perform work-related activities due to poor health status or disability of ailing member for entire life along with loss of income of care-giving member (Atake 2018, Mitra, Palmer, Mont and Groce 2016). The impact of health shocks on household welfare is a matter of concern among the policy makers. While aggregate shocks in the form of droughts and floods are found to have profound effects on household welfare, health shocks are idiosyncratic and unpredictable in nature and pose serious challenges to those households that face it (Narayan, Chambers, Shah and Petesch 2000). When households are faced with health shocks in short term, they are forced to reduce basic consumption and substitute it with healthcare spending (Somi, Butler, Vahid, Njau and Abdulla 2009, Kabir, Rahman, Salway and Pryer 2000). In long term, it
Priyanka Dasgupta, Assistant Professor, PES University, Bengaluru 560085, Karnataka, Email: pdg0812@gmail.com
Subrata Mukherjee, Associate Professor, Institute of Development Studies Kolkata (IDSK), Kolkata 700064, West Bengal, Email: msubrata100@gmail.com
Priyanka Dasgupta is a recipient of Indian Council of Social Science Research (ICSSR) Doctoral Fellowship. This article is a part of her doctoral dissertation work sponsored by ICSSR. However, the responsibility for the facts stated, opinions expressed and the conclusions drawn is entirely that of the author.
tends to reduce net investment flows for productive activities (Somi, et. al. 2009). This implies that there is a certain possibility that high health expenditure induced by health shocks might lead households to poverty in future or make them even poorer.
Empirical evidence also shows that health shocks have significant negative impact on household current welfare (Lucas and Bloom 2006, Devereux, Baulch, Macauslan and Sabates-Wheeler 2006). As such households are exposed to the medical poverty trap, a situation when medical costs lead a household into poverty or increase the poverty of those who are already poor (Whitehead, Dahlgren and Evans 2001). Under these circumstances, a household is said to be vulnerable to poverty due to health shock if the net value of its consumption expenditure falls below poverty line, due to occurrence of any illness/injury which results in payment of high out-of-pocket (OOP) health care expenses. Vulnerability to poverty is a forward looking or ex-ante measure of welfare defined as “a probability: the risk a household will fall into poverty at least once in the next few years” (Duflo 2005).
India faces a high risk of financial burden as its share of out-of-pocket (OOP) expenditure is 62.7 per cent of the total health expenditure (WHO 2018). In fact, household health spending is growing faster than household consumption expenditure in India (Mohanty, Ladusingh, Kastor, Chauhan and Bloom 2016). Evidence also suggests that 3.5 per cent of the population is pushed below poverty line in 2011-2012 as a result of OOP medical payments in India (Hooda 2017). However, these analyses are ex-post in nature and do not capture ex-ante impact of illness shocks on household welfare. This implies that the effect of health shocks realised as high OOP healthcare expenses on the future well-being or vulnerability to poverty of households has been grossly ignored in empirical literature, especially in the Indian context. With a dearth of studies on vulnerability to poverty due to health shocks among Indian households, our contribution in this regard is to estimate a forward-looking measure of welfare, i.e., vulnerability to poverty and to analyse whether household health status affects vulnerability to poverty in India. This study also aims to identify the socio-economic determinants of vulnerability. To the best of our knowledge, this is one of the first studies that have examined the relation between household health status and vulnerability to poverty among Indian households.
II Methodology
Study Design and Sample Selection
The study uses secondary data from the latest 75th Health Round of National Sample Survey (NSS) (2017-2018) conducted in July 2017-June 2018 with a sample size of 113,816 households (NSS 2019). Adopting multi-stage stratified sampling method, the survey collected detailed household and individual level
information, along with information on reported morbidity, health care utilization and health care expenditure. The recall period for any information on hospitalisation and outpatient (OP) care is one year and 15 days preceding the survey respectively.
Variables
Dependent Variable: Net household consumption expenditure has been used as the dependent variable in vulnerability estimation. It is calculated by subtracting total health expenditure from total consumption expenditure of the household. For estimating total health expenditure, total outpatient expenditure (reference period is 15 days) and total inpatient expenditure (reference period is 365 days) is calculated separately for the households. Then they are converted into monthly estimates and added to get total health expenditure. The choice of net household consumption expenditure as the dependent variable can be validated on two grounds. First, a household with high health expenditure is not considered as poor, even if its consumption of basic commodities has fallen below the poverty threshold during that time. Second, a household living below poverty line but resorting to borrowing to finance the healthcare expenses will not be considered as poor since total expenditure will rise above the poverty line. Thus, subtracting health expenditure can best reflect the impact of health shocks on expected mean consumption expenditure, while ignoring it will result in an overall- underestimation of vulnerability.
Independent Variable: In this study, the proxy of health shocks is the health status of the household. This variable has been approximated by standardization of any event of illness and/or injury in the household. This is done by dividing number of members who are suffering from any illness/injury during the last 15 days preceding the survey or any event of hospitalisation during the last 365 days preceding the survey with the total number of household members (Atake 2018, Novignon, Nonvignon, Mussa and Chiwaula 2012).
Household hygienic condition proxied by presence of safe drinking water and hygienic sanitation facilities are included to complement the household’s health status (Atake 2018, Novignon, et. al. 2012). Households with drinking water sources like bottled water, piped water in dwelling or outside, tube well/bore well (inside/outside), water supplied through containers (tanker/truck/drum) and having a community RO plant, are considered as having safe drinking water facilities. On the other hand, households having drinking water sources like protected well (inside/outside), protected spring/pond, unprotected source (river/canal/spring/ pond/ well) and other sources are considered as having unsafe drinking water facilities. Households with hygienic sanitation facilities are those which have either flush and/or pit latrines; while households having no latrine facilities or defecating in open space and other types of latrines have been classified as having unhygienic sanitation facilities.
Other variables which might affect household welfare are sector (rural/urban), household size (number of members in household), household occupational category (self-employed, casual labour, regular wage /salaried and others), having at least one member with health insurance coverage, type of insurance coverage (government sponsored insurance coverage, insurance sponsored by private employer, insurance arranged by household, other types of insurance), caste group (Scheduled Tribe (ST), Scheduled Caste (SC) and Other Backward Caste (OBC)/others), region (north-central, east, north-east, west, south) and gender of household head (male/female) and education status of household head (no education, primary, secondary, tertiary) (Atake 2018, Mitra, et. al. 2016, Novignon, et. al. 2012). In addition, the presence of at least one child, one elderly person and one female in the reproductive age-group in the household are also considered, as these groups are more likely to be ailing at any given point of time thereby increasing their health expenditure in the process (Dhanaraj 2014, Joe 2015).
III Data Analysis
Empirical Approach
In the empirical literature, there are 3 principal approaches that can be used to estimate vulnerability- vulnerability as expected poverty (VEP), vulnerability as low expected utility (VEU) and vulnerability as uninsured exposure to risk (VER). These approaches provide a model that estimates a measure of welfare (Christiaensen and Boisvert 2000). VEP is the probability that expected consumption expenditure of a household will fall below the poverty line in future (Christiaensen and Boisvert 2000). VEU, on the other, is the difference between utility derived from a certain consumption level that would be its equivalent and to which or beyond which, the household will not be considered as vulnerable. VER approach captures the welfare loss of household, due to lack of efficient risk management mechanism (Ligon and Schechter 2003).
Our study uses the VEP approach (Novignon, et. al. 2012, Chaudhuri 2003) to analyse vulnerability resulting from health shocks. There are two reasons which justify the choice of VEP approach over VEU and VER approaches. First, VEP approach allows the use of cross section data for estimation of vulnerability, unlike VEU and VER approaches which require panel data (Novignon, et. al. 2012, Chaudhuri 2003). Second, contrary to VEU approach, VEP approach allows ex- ante estimation of vulnerability due to any negative shock (Novignon, et. al. 2012).
The probability that a household h will find itself consumption poor in time t+j is given as
𝑉ht = 𝑃𝑟 (𝑙𝑛𝐶h,t+j < 𝑙𝑛𝑧) …(1)
Where 𝑉ht represents vulnerability of household h at time t, 𝐶h,t+j is consumption expenditure of household h, at time t+j, z is the poverty line, and ln is the natural log.
The consumption generating process can be specified as
𝑙𝑛𝐶h = 𝑋h𝛽 + 𝜖h …(2)
Where 𝐶h is consumption expenditure of household h, 𝑋h is observable household characteristics in terms of non-stochastic household determinants, household’s exposure to shocks and coping strategies with respect to health shocks, 𝛽 is a vector of parameters, and 𝜖h is zero-mean disturbance term. Two assumptions need to be made for using cross section data- (i) the disturbance term 𝜖h is log normally distributed, implying that 𝐶h is also log normally distributed. This assumption is made to enable the estimation of the probability that a household with a given set of characteristics will be vulnerable to shocks. (ii) The economy is assumed to be stable during the period of analysis.
Thus, any household h, with characteristics 𝑋h will be vulnerable to poverty due to health shocks using the estimated coefficients of equation 2.
𝑉ˆht = 𝑝𝑟 (𝑙𝑛𝐶h,t+j < 𝑙𝑛𝑧|𝑋h) …(3)
Allowing for heteroscedasticity, we assume the variance of 𝜖h to be related to the household characteristics in some parametric way as:
𝜎2 = 𝑋h∅ + 𝜇h …(4)
To estimate ∅ , a three stage Feasible Generalized Least Squares (FGLS) procedure suggested will be used. At the first stage, equation (2) is estimated using Ordinary Least Squares (OLS) procedure. The estimated residuals will then be used to estimate the equation (5) by OLS
𝜎^2 = 𝑋h∅^ + 𝜇̂h …(5)
The predicted values from equation (5) are used to transform equation (5) as:
σ2 K μ
OLS,h = h ∅ + h
…(6)
Kh∅^ Kh∅^ Kh∅^
Now equation (6) will be estimated by OLS which will give ∅^FGLS. Here, 𝑋h
∅^FGLS
is the efficient estimate of 𝜎2 which is the variance of the idiosyncratic component of household consumption. The standard error of ∅^FGLS is used to transform equation (2):
𝜎^G,h = √𝑋h
∅^FGLS
…(7)
lnWh = Kh 𝛽 + Gh
…(8)
σ^ച,h
σ^ച,h
σ^ച,h
Estimating equation 8 using OLS will give us 𝛽^. These values of 𝛽ˆFGLS and ∅^FGLS will enable the estimation of expected log consumption as denoted by equation (9) and expected variance of log consumption as denoted by equation (10) respectively. Thus,
𝐸 [(𝑙𝑛𝐶ˆh|𝑋h)] = 𝑋h𝛽^ …(9)
𝑉𝑎𝑟[(𝑙𝑛𝐶^h|𝑋h)] = 𝜎^2 = 𝑋h∅^ …(10)
Now at the final stage, vulnerability to poverty can be estimated as
𝑉^ l nz–K βˆ ) …(11)
√Kh∅^FGLS
Thus, estimation of vulnerability due to health shocks depends on the assumption of normal distribution of log transformed consumption values, choice of poverty line, the expected level and variability of log consumption.
Time Horizon and Poverty Line
Regarding time horizon required to be vulnerable to poverty due to shocks, literature shows that time horizon and welfare are quite arbitrary and households can become poor exactly in one period or in any successive periods after illness shocks and as such, the time horizon has been specified as t+j instead of t+1, with j≥ 1 (Atake 2018, Novignon, et. al. 2012). The poverty lines for 2017 have been estimated by using the poverty line figures of 2011-2012 and Consumer Price Index for Industrial Workers (CPIIW) and Consumer Price Index for Agricultural Workers (CPIAL) for the year 2017 (Planning Commission 2014, Labour Bureau 2017).
Threshold for Vulnerability to Poverty
The threshold for vulnerability due to health shocks is taken as 0.5 (Novignon, et. al. 2012, Chaudhuri 2003). The choice of this threshold can be justified on multiple grounds. First, it makes more sense to say that a household with 50 per cent probability of falling in poverty, in the next period, is vulnerable to poverty. Thus, households with an estimated vulnerability to poverty of 0.5 and more are
vulnerable to poverty (Novignon, et. al. 2012). Second, when a household with the current level of consumption equal to poverty line, faces a zero-mean shock, the estimated vulnerability to poverty is 0.5 (Atake 2018). In the limit, when the time horizon approaches zero, being currently poor and currently vulnerable to poverty coincides (Atake 2018). Vulnerability to poverty is measured in terms of percentage of vulnerable households and mean vulnerability. Higher mean vulnerability implies higher probability to be vulnerable to poverty due to health shocks (Atake 2018). All analyses are conducted using statistical software STATA version 14 taking into account sample weights.
IV Results
Descriptive Statistics
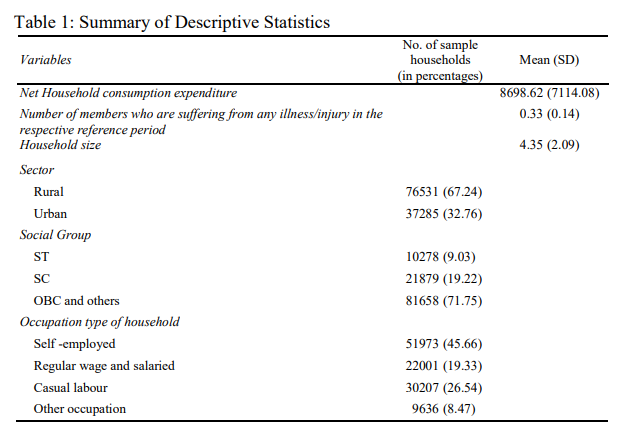
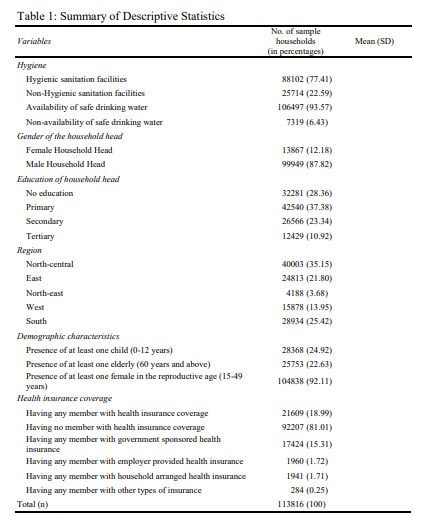
Table 1 shows that on average, 33 individuals per 100 households reported illness/injury during the last 15 days preceding the survey, or at least one event of hospitalisation during the last 365 days preceding the survey. Average monthly consumption expenditure of the household is Rs. 8699 (approx.) with an average household size of 4. Regarding insurance coverage of households, it is observed that 18.99 per cent of the sample households have at least one member having insurance coverage and 15.31 per cent of the households have at least one member with government sponsored insurance coverage
Vulnerability to Poverty
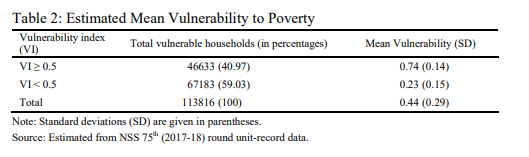
The average estimated vulnerability to poverty is 0.74, with 40.97 per cent of households being vulnerable to poverty due to health shocks (Table 2). Comparing
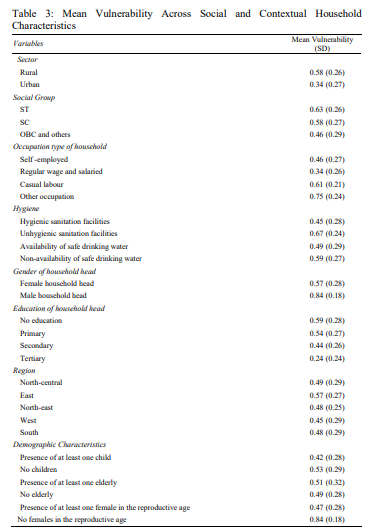
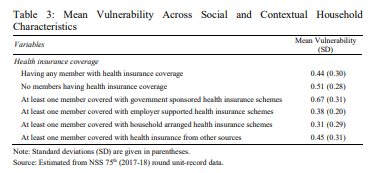
mean vulnerability to poverty across household characteristics reveals that rural households are comparatively more vulnerable than their urban counterparts. It is also evident that ST and SC households have higher mean vulnerability to poverty than households belonging to OBC and general caste groups (0.63 for ST and 0.58 for SC vs 0.46 for OBC/other caste respectively). Further, households with members employed as casual labourers have higher mean vulnerability to poverty (0.61) in comparison to self-employed and regular wage/salaried households (0.46 and 0.34 respectively). It is further evident from the analysis that households with unhygienic sanitation facilities and poor drinking water facilities have high mean vulnerability (0.67 and 0.59 respectively) than their better-off counterparts (0.45 and 0.49 respectively). We also find that male headed households are more vulnerable to poverty than female headed ones (0.84 vs 0.57). Also, households with illiterate heads have higher mean vulnerability (0.59) than household heads educated up to primary, secondary and tertiary levels (0.54, 0.44, 0.24 respectively), with mean vulnerability rising as education level of the household heads falls. Estimating vulnerability to poverty across various demographic characteristics shows that households with no children and no females in the reproductive period are more vulnerable to poverty than their corresponding counterparts. This implies that health status of members other than children and females, might play a vital role in increasing the mean vulnerability which is corroborated by the finding that households with at least one elderly member having higher mean vulnerability as compared to households with no elderly members (0.51 vs 0.49). This may be caused primarily because elderly members have high incidence of illness than non-elderly members, which can increase the overall mean vulnerability. Incorporating insurance coverage among household members in vulnerability analysis further shows that households with no insured members, have higher mean vulnerability than households with insured members (0.51 vs 0.44). Analysing across type of insurance coverage, we find that households with at least one member covered with government sponsored health insurance have higher mean vulnerability (0.67) than households with members having other types of insurance coverage such as supported by employer, arranged by household and other schemes (0.38, 0.31 and 0.45 respectively) (Table 3).
Determinants of Vulnerability to Poverty
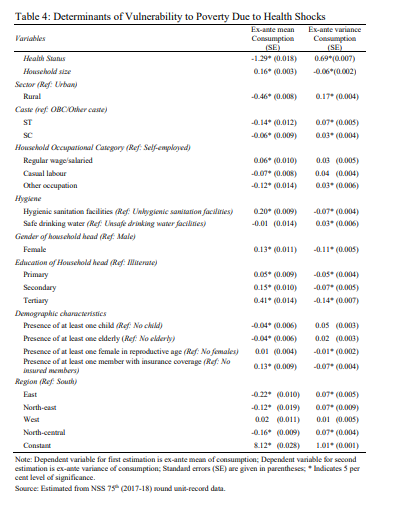
The determinants of vulnerability to poverty due to household illness status has been exhibited in Table 4. We find that there is a negative relationship between vulnerability to poverty and household health status which implies that vulnerability to poverty is higher for households with more ailing members. Also, vulnerability to poverty is higher when the household size is high. Relative to urban areas, households in rural areas are estimated to be more vulnerable to poverty. Even compared to OBC/other caste groups, ST and SC households have higher vulnerability to poverty. Furthermore, households with members engaged as casual labourers are more likely to be vulnerable to poverty due to health shocks relative to households with self-employed members. It is also important to note that households with access to hygienic sanitation facilities are less likely to be vulnerable to poverty. The results also suggest that higher education level of household head relates to lower expected mean of consumption, implying lesser vulnerability to poverty. In addition, it has been observed that higher number of children and elderly in the household increase vulnerability to poverty by lowering expected consumption. A crucial finding of the study is that for households having any member with insurance coverage reduces vulnerability to poverty due to health shocks relative to households with no insured members
II Discussion
The results of our study indicate that current health status of households play a critical role in determining vulnerability to poverty. As general health status of a household declines or share of ill members in the household rises, future expected consumption expenditure gets reduced, making the households more vulnerable to poverty (Atake 2018, Novignon, et. al. 2012). The study finds that rural households have higher mean vulnerability than urban ones, implying that the former are unable to shield earned income and consumption expenditures in the face of illness shocks (Mitra, et. al. 2016). Our analysis also suggests that SC and ST households and households with members employed as casual labourers are more vulnerable to poverty than their corresponding counterparts. Evidence from ex-post analysis also supports that ST and SC households have uniformly higher poverty levels than OBC and general caste households while households with members employed as casual labourers have highest levels of poverty of all types of employment groups (Sundaram and Tendulkar 2003).
An interesting finding of the study is that households with hygienic sanitation facilities are found to be less vulnerable than their counterparts, thereby confirming that households with good hygiene are more likely to have good health and consequently lower health expenditure resulting in improved welfare. Thus, health is both a consumption and investment commodity, as good health status enables individuals to be more productive and get positive returns from consumption and investment activities (Atake 2018, Novignon, et. al. 2012).
We also find that male headed households are more prone to be vulnerable to poverty than female headed households (Novignon, et. al. 2012). It is also further revealed that as education of the household head goes higher, the households become lesser vulnerable to poverty (Atake 2018, Novignon, et. al. 2012). This implies that educated household heads are more likely to have well-paying income sources than can attenuate the impact of health shocks on vulnerability to poverty (Glewwe and Hall 1998). The study also finds that having more children and elderly in the household makes them more vulnerable to poverty. Both elderly and children are more prone to be ailing and seek healthcare resulting in increased OOP payments in the current period, which might reduce their net consumption expenditure in future (Kumara and Samaratunge 2017).
Also, households having any member covered with insurance coverage are less vulnerable to poverty. Evidence from related studies also asserts that health insurance tends to reduce current OOP health expenditure, thereby reducing vulnerability and poverty (Sepehri, Simpson and Sarma 2006). Quite interestingly, we further find that households with at least one member having government sponsored health insurance are more vulnerable to poverty than households having members with other types of insurance coverage. This suggests that government sponsored health insurance coverage increases the risk of reduction in net consumption expenditure in future. Empirical evidence shows that hospitalization expenditure has increased after introduction of government sponsored health
insurance schemes in India (Selvaraj and Karan 2012). Also, government sponsored health insurance schemes have limited cap amounts and households enrolled in schemes such as Rashtriya Swasthya Bima Yojana (RSBY) are found to incur additional OOP spending on drugs and diagnostics which can make them more vulnerable to poverty (Karan, Yip and Mahal 2017).
Lastly, the study identifies key determinants of vulnerability to poverty, apart from household health status. The salient characteristics that make households more vulnerable to poverty are the household’s location in rural areas, belonging to ST and SC groups, having members employed as casual labourers, male household heads, low education of household heads, presence of elderly and children in household and absence of insured members in the household. An additional finding is that large households have lower mean vulnerability than small households. This might be attributed to ‘economies of household size’ as big household size represents good labour force resulting in increased income. Also, members in big households can get more out of their household income in the form of shared rent, housing bills and bulk purchases of food commodities which can thereby reduce vulnerability to poverty in future (Muleta and Deressa 2014).
The study is not free from limitations. The first limitation is lack of panel data to estimate vulnerability that would have otherwise helped in the analysis of inter- temporal consumption expenditure. The second limitation is that the study is based on data that uses self-reported measures of consumption and health expenditure and self-reported morbidity status. In spite of the aforementioned limitations, it must also be noted that the study highlights the importance of future poverty and confirms its link with household health status, given the scarcity of empirical evidence on these issues in developing economies and particularly in India.
III Conclusion
With an absence of adequate empirical evidence on the relationship between health status and vulnerability to poverty, our study attempts to examine vulnerability to poverty due to health shocks among Indian households using a 3-step FGLS approach. Using NSS 75th health round (2017-2018), this study develops first of its evidence that in India, presence of ill members in the household reduces household future consumption and makes them vulnerable to poverty. Other causal factors of vulnerability are location of the household in rural areas, belonging to disadvantaged caste groups, having members employed as casual labourers, having elderly and children in the household, male household head, low education levels of household head and presence of uninsured members in the household.
The findings of the study imply that deprivations due to health status need to be viewed from a broader perspective that goes beyond the poverty status at a specific period of time. It also implies that reduction of vulnerability to poverty, or stabilizing consumption in the event of a health shock in the household, can be achieved by expansion of health insurance programs that aim at lessening OOP health expenditure of households as well as focusing on education and access to
hygienic sanitation facilities. These findings will play an instrumental role in developing integrated programmes that improve health status and human capital along with stabilizing consumption in future, especially in the context of COVID- 19 pandemic.
References
Atake, E.H. (2018), Health Shocks in Sub-Saharan Africa: Are the Poor and Uninsured Households more Vulnerable?, Health Economics Review, 8(1): 1-13.
Chaudhuri, S. (2003), Assessing Vulnerability to Poverty: Concepts, Empirical Methods and Illustrative Examples, Department of Economics, Columbia University, New York, 56.
Christiaensen, L.J. and R.N. Boisvert (2000), On Measuring Household Food Vulnerability: Case Evidence from Northern Mali, Cornell University Working Paper, 05.
Devereux, S., B. Baulch, I. Macauslan, A. Phiri and R. Sabates-Wheeler (2006), Vulnerability and Social Protection in Malawi, Institute of Development Studies Discussion Paper, 387.
Dhanaraj, S. (2014), Health Shocks and Coping Strategies: State Health Insurance Scheme of Andhra Pradesh, India, WIDER Working Paper, 003.
———- (2016), Economic Vulnerability to Health Shocks and Coping Strategies: Evidence from Andhra Pradesh, India, Health Policy and Planning, 31(6): 749-758.
Duflo, A. (2005), Health Shocks and Economic Vulnerability in Rural India: Break the Vicious Circle, Centre for Micro Finance Research Working Paper, IFMR.
Glewwe, P. and G. Hall (1998), Are Some Groups More Vulnerable to Macroeconomic Shocks than Others? Hypothesis Tests based on Panel Data from Peru, Journal of Development Economics, 56(1): 181-206.
Hooda, S.K. (2017), Out-of-Pocket Payments for Healthcare in India: Who have Affected the Most and Why?, Journal of Health Management, 19(1): 1-15.
Joe, W. (2015), Distressed Financing of Household Out-of-Pocket Health Care Payments in India: Incidence and Correlates, Health Policy and Planning, 30(6): 728-741.
Kabir, M.A., A. Rahman, S. Salway and J. Pryer (2000), Sickness among the Urban Poor: A Barrier to Livelihood Security, Journal of International Development: The Journal of the Development Studies Association, 12(5): 707-722.
Karan, A., W. Yip and A. Mahal (2017), Extending Health Insurance to the Poor in India: An Impact Evaluation of Rashtriya Swasthya Bima Yojana on Out-of-Pocket Spending for Healthcare, Social Science and Medicine, 181(1): 83-92.
Kumara, A.S. and R. Samaratunge (2017), Impact of Ill-health on Household Consumption in Sri Lanka: Evidence from Household Survey Data, Social Science and Medicine, 195(1): 68-76.
Labour Bureau of India (2017), Index Numbers: Statistical Data for Labour, New Delhi.
Ligon, E. and L. Schechter (2003), Measuring Vulnerability, The Economic Journal, 113(486): C95- C102.
Lucas, H. and G. Bloom (2006), Protecting the Poor against Health Shocks, In International Conference, Rajendrapur, Bangladesh: BRAC.
Mitra, S., M. Palmer, D. Mont and N. Groce (2016), Can Households Cope with Health Shocks in Vietnam?, Health Economics, 25(7): 888-907.
Mohanty, S.K., L. Ladusingh, A. Kastor, R.K. Chauhan and D.E. Bloom (2016), Pattern, Growth and Determinant of Household Health Spending in India, 1993–2012, Journal of Public Health, 24(3): 215-229.
Muleta, A.N. and D.F. Deressa (2014), Female Headed Households and Poverty in Rural Ethiopia, Science, Technology and Arts Research Journal, 3(1): 152-155.
Narayan, D., R. Chambers, M.K. Shah and P. Petesch (2000), Voices of the Poor: Crying out for Change, Oxford University Press, New York.
National Sample Survey Office (2019), Key Indicators of Social Consumption in India: Health (July 2017-June 2018), New Delhi.
Novignon, J., J. Nonvignon, R. Mussa and L.S. Chiwaula (2012), Health and Vulnerability to Poverty in Ghana: Evidence from the Ghana Living Standards Survey Round 5, Health Economics Review, 2(1): 1-9.
Planning Commission (2014), Report of The Expert Group to Review the Methodology for Measurement of Poverty, New Delhi.
Selvaraj, S. and A.K. Karan (2012), Why Publicly-Financed Health Insurance Schemes are Ineffective in Providing Financial Risk Protection, Economic and Political Weekly, 47(11): 60-68.
Sepehri, A., W. Simpson and S. Sarma (2006), The Influence of Health Insurance on Hospital Admission and Length of Stay—The Case of Vietnam, Social Science and Medicine, 63(7): 1757-1770.
Somi, M.F., J.R. Butler, F. Vahid, J.D. Njau and S. Abdulla (2009), Household Responses to Health Risks and Shocks: A Study from Rural Tanzania raises some Methodological Issues, Journal of International Development: The Journal of the Development Studies Association, 21(2): 200-211.
Sundaram, K. and S.D. Tendulkar (2003), Poverty among Social and Economic Groups in India in 1990s, Economic and Political Weekly, 38(50): 5263-5276.
Whitehead, M., G. Dahlgren and T. Evans (2001), Equity and Health Sector Reforms: Can Low- income Countries Escape the Medical Poverty Trap?, The Lancet, 358(9284): 833-836.
World Health Organization (2018), Global Health Expenditure Database, Available from: https://apps.who.int/nha/database/country_profile/Index/en.