Capacity Utilisation in Indian Pharmaceutical Industry: A Non-Parametric Frontier Analysis
March 2024 | Jaswinder Singh and Kawaljeet Kaur
Abstract
The present paper endeavours to analyse the production structure and provide the trends of Capacity Utilization (CU) in Indian pharmaceutical industry during the period 1980-1981 to 2017-2018 by using the non-parametric frontier analysis. Tobit regression analysis has also been used to examine the factors affecting variations in capacity utilization. For this purpose, the entire period has been divided into pre-reforms, post-reforms, pre-TRIPS (Trade Related Intellectual Property Rights) and post-TRIPS period respectively. The empirical analysis based on the econometric technique shows that the translog production function with capital using non-neutral technological progress represents the technological relationship in Indian pharmaceutical industry. The empirical results reveal that the Indian pharmaceutical industry is operating with an average excess capacity to the tune of 11.4 per cent during the entire study period. However, the comparative analysis of capacity utilization during the pre-reforms and post-reforms period reveals that the average excess capacity has marginally declined in the post-reforms period by about 0.50 per cent. Moreover, it has also been observed that the excess capacity in Indian pharmaceutical industry has decreased from 12.2 per cent in pre-TRIPS period to 9.9 per cent during the post-TRIPS period. Therefore, the result shows that both the economic reforms and implementation of TRIPS agreement has a favourable impact on the capacity utilization in Indian pharmaceutical industry. Further, the analysis for the factors affecting capacity utilization in Indian pharmaceutical industry reveals that the selected explanatory variables like skill and profitability in the industry significantly affect the capacity utilisation levels in Indian pharmaceutical industry. Therefore, it can be inferred that in the era of globalization Indian pharmaceutical industry has to comply with strict business standards and boost the level of investment in the Research and Development activities in order to expand and utilize the potential capacity during the post-TRIPS regime.
Key Words
Capacity utilization, Data envelopment analysis, Pharmaceutical industry, TRIPS, Panel data tobit- regression.
Introduction
The basic objective of this paper is to analyse the inter-temporal variations in the Capacity Utilization (CU) of Indian pharmaceutical industry. The relevance of the study stems from the fact that the technical efficiency of Indian pharmaceutical industry remains constant throughout the study period and the variations in the technical efficiency of Indian pharmaceutical industry are very weak, therefore, the capacity utilization and productivity are the major factors which influence the growth of Indian pharmaceutical industry in the current economic scenario (Singh and Singh 2016). It is a well-known fact that the under-utilization of production capacity causes low level of pharmaceutical production, therefore, low level of production leads to mismatch in demand and supply and it results in the increase in price of medicinal and pharmaceutical products. The CU measure enables an industry to know about the extent of idle excess capacities available, and the inter- temporal differences in the degree of CU which depend precisely upon the ability in adjusting their fixed factors in the short run and the instances of cost inefficiency behaviour frequently observed in most industries are precisely due to the inability of adjusting fixed factors. It is therefore imperative to analyse the industry’s behaviour concerning capacity utilization, as a key economic parameter of performance, in any competitive set up.
The analysis of CU also carries worth because “The Indian Pharmaceutical industry has achieved an eminent global position in the pharma sector and has been witnessing phenomenal growth in recent years. It is well known that India is emerging as a world leader in generic pharmaceuticals production, supplying 20 per cent of the global market for generic medicines. The industry accounts for 8 per cent of global production, and is exporting to over 200 countries. Indian pharmaceutical industry is a major vaccine producer and has 18 major vaccine manufacturing facilities. These vaccines are used for the national and international market which makes India a major vaccine supplier across the globe. Although India is the global supplier of high quality medicines, maintaining continuous access to essential medicines remains a challenge to the health system. To maintain continual access to affordable medicines and health products, it is necessary for Indian pharmaceutical industry to augment and engage in optimum utilization of its production capacity and to strengthen the generic Indian pharmaceutical enterprises to meet the quality, safety and efficacy standards at national and global level. This would further require efficient production and technology adoption measures to ensure smooth access to the essential and good quality medicines” (Indian Pharma Summit, 2014-2015).
India has initiated the major economic reform program in 1991 and by virtue of the economic reforms, Indian pharmaceutical industry has witnessed the intensive changes in its policy framework. The basic objective of the economic reforms of 1991 is to make the Indian industries as well as the entire economy technically efficient, technologically up-to-date and globally competitive, which will further ensure the rapid economic growth. The Indian pharmaceutical industry has testified a major policy change as a result of economic reforms and TRIPS agreement under the aegis of WTO, which includes the deregulation of Indian industry and price controls were gradually being dismantled under the purview of Drugs Price Control Order (DPCO).
Moreover, the Drugs and Pharmaceutical industry of India has flourished under the process patent regime under the Indian Patent Act 1970, but in the globalised regime, the Indian pharmaceutical industry is required to follow the regulations of TRIPS agreement (product as well as process patent), which intends the industry to improve its production capacity and global competitiveness. To meet the TRIPs obligations, India has amended its patent law on March 22, 2005, by abolishing its “process” patents law and reintroduced “product” patent for pharmaceuticals products. Therefore, the Indian pharmaceutical industry has to compete with strict business standards and the implementation of TRIPS agreement has necessitated to boost the level of investment in the research and development in collaboration with the foreign MNCs or with the public research institutes, because research and development has been considered as the backbone of the pharmaceutical industry. Apart from the domestic investment, foreign capital in the form of Foreign Direct Investment (FDI) is essentially required with a view to bring new technology and research and managerial capabilities (Mazumdar 2013).
It is a well acknowledged fact that the performance of an industry depends upon the product of both internal and external environment factors. The external factors are uncontrollable from the management point of view like changes in the international standards under WTO, amendments in Patent Act and other government regulations, whereas the internal factors are controllable in nature like under-utilisation of capacity, inefficient use of inputs and other managerial inefficiencies. Moreover, in the current economic scenario, each and every industry is constantly engaged in the process of self-appraisal and search for tools for assessing its own current performance. This performance can be judged suitably by analysing the inter-temporal variations in various variables and performance indicators. In a capital scarce economy like India, manufacturing capacity utilization is a key indicator of economic performance which not only determines how much more output can be obtained by fuller utilization of existing capacity but also defines the required expansion of capacity. Thus, the study of capacity utilization is very important, because if Indian Pharmaceutical industry utilizes its optimum capacity then it will be able to expand on a sustained path and to match the medicinal demand (Drugs and medicine) of the society. Therefore, various experts have suggested that the sustained growth of Indian pharmaceutical industry is possible only through the efficient and optimum utilization of production capacity and with minimum wastage of resources.
In India, a very few attempts have been made to analyse the trends of capacity utilization in Indian manufacturing at aggregated level covering the Indian pharmaceutical industry, viz., Koti (1968), Divetia and Verma (1970), Karim and Bhinde (1975), Seth (1986), Bhanu (2006), Sastry (1980), Mohandoss and Subrahmanyam (1981), Subba Rao (1981), Burange (1992), Goldar and Ranganathan (1992), Burange (1993), Pohit and Satish (1995), Azeez (2002), etc. More specifically Ray and Pal (2008) have estimated the trends of Capacity Utilization in Indian Pharmaceutical industry during 1979-1980 to 2003-2004. The study has estimated the Translog cost frontier along with capacity utilization by applying minimum capital output ratio method. The analysis revels that the trends of CU were declining during the study period. However, after the mid 90’s the low actual output growth leads to significant declining trends of the CU in the industry. The study also shows that rapid expansion of capacity output as a result of economic reforms and stagnant demand were the main reasons for the declining trends of the CU in Indian chemical industry. Moreover, Sarba P. Ray (2011) has estimated the trends of capacity utilization in Indian pharmaceutical industry during 1979-1980 to 2007-2008 and assessed the impact of economic reforms on capacity utilization. The analysis found that the capacity utilization decreased in the post-reforms period as compared to the pre-reforms period, whereas the capacity output showed the increasing trends in the post-reforms period. In the above mentioned literature, most of the work has been done relating to the overall Indian manufacturing sector and comparatively scant attention was paid by the researchers to analyze the performance of Indian pharmaceutical industry during the post liberalisation and post-TRIPS period. After a careful perusal of the above studies, it has been observed that not much work has been done relating to inter- temporal comparisons of CU in Indian pharmaceutical industry.
The literature examination reveals that most of the studies have used conventional measures in measuring CU, and have paid insufficient attention to the possible theoretical problems. Since most of them followed the conventional engineering (installed capacity) and Wharton approaches, the principal problem underlying the interpretation of most of the existing studies is the weak link between the underlying economic theory and the used measures of capacity utilization. The present study is an attempt in this direction and aims to enrich the literature on capacity utilisation in Indian industries. This paper attempts to estimate the inter-temporal variations in the trends of capacity utilization in Indian pharmaceutical industry during the period 1980-1981 to 2017-2018 and it also assesses the impact of economic reforms and TRIPS agreement on capacity utilization in Indian pharmaceutical industry. For analysis purpose, linear programming based Data Envelopment Analysis (DEA) has been used to compute the capacity utilization variations in Indian pharmaceutical industry. “The choice of DEA to compute capacity utilization levels is governed by the fact that it is a non-parametric technique and doesn’t require a priori specification of production function. Also, the information on input prices is not required to obtain the estimates of capacity utilization levels. In this context, the present paper has been divided into four sections. Section I discusses the database and construction of relevant input and output variables and it also outlines the basic concept of capacity utilization and methodological framework to compute capacity utilization and it also provides the theoretical underpinnings and methodological framework for the estimation of production structure. Section II presents the empirical results pertaining to the production structure and trends of inter-temporal variations in capacity utilization in Indian pharmaceutical industry whereas Section III discusses the empirical results of Tobit regression model estimation to evaluate the factors influencing the CU levels in Indian pharmaceutical industry. The last section concludes the discussions along with some policy suggestions.
I Construction of Input-Output Variables
Our empirical analysis is confined to the period 1980-1981 to 2017-2018, which has been further divided into four sub-periods on the basis of changes in macroeconomic policy governing the Indian economy and international agreements: i) Pre-reforms period (1980-1981 to 1990-1991); ii) Post-reforms period (1991-1992 to 2017-2018); iii) Pre-TRIPS period (1980-1981 to 2004- 2005) and iv) Post-TRIPS period (2005-2006 to 2017-2018). For the analysis purpose, the four-digit aggregate level data has been extracted from the various reports of “Summary Results of Annual Survey of Industries”, a publication of Central Statistical Organization (CSO), Government of India. In the present study, one output (gross value added at constant prices) and two inputs (gross fixed capital at constant prices and number of employees) has been taken into account. All the monetary data have been deflated by using the appropriate price deflators at 2011-2012 base year. The detailed definitions of these inputs and outputs have been given in ASI as follows:
Gross Value Added
In the present study gross value added has been used as a measure of output, because “depreciation charges in the Indian industries are known to be highly arbitrary fixed by the income tax authorities and seldom represent true/actual capital consumption” (Jayadevan 1995, Goldar 1986). The Annual survey of industries publishes the series by using the following relation:
GVA = TO – TI …(1)
Where GVA means Gross Value Added, TO and TI represent Total Output and Total Input respectively.
“The figures of Gross Value Added are arrived at by deducting the cost of total input from the value of total output. The figures of ‘total output’ comprise of total ex-factory value of products and by-products manufactured as well as other receipts from non-industrial services rendered to others, work done for others on material supplied by them, value of electricity produced and sold, sale value of goods sold in the same conditions purchased, addition in stock of semi- finished goods and value of own construction. However, ‘total inputs’ comprise of total value of fuels, materials consumed as well as expenditures such as cost of contract and commission work done by others on materials supplied by the factory, cost of materials consumed for repair and maintenance work done by others to the factory’s fixed assets, inward freight and transport charges, rate and taxes (excluding income tax), postage, telephone and telex expenses, insurance charges, banking charges, cost of printing and stationery and purchase value of goods sold in the same condition as purchased. Rent paid and interest paid are not included” (ASI)”.
Labour Input
The Annual Survey of Industries provide three distinct measures of the labour input; a) Man-hours worked, b) Number of workers and c) Number of employees (which include both workers and persons other than workers such as supervisors, technicians etc. The present study has used the number of employees consisting of both non-production and production workers as a measure of labour input. As per the definition provided by ASI “the production workers relate to all persons employed directly or through agency whether for wages or not and engaged in any manufacturing process or in cleaning any part of the machinery or premises used for manufacturing process that are lying under the production workers. However, persons holding the positions of supervisor, or management or employed in administrative office, store keeping section and welfare section, engaged in the purchase of raw material, etc., are included in the non-production workers” (ASI).
Capital Input
In the present study, “we use the gross fixed capital stock as a measure of capital input. The standard practice of perpetual inventory method has been followed here to generate the series of gross fixed capital stock at constant prices. This requires a gross investment series, an asset price deflator, a depreciation rate, and a benchmark capital stock. We followed the procedure adopted by Martin and Warr (1990), Austria and Martin (1995), Wu (1997) and Fan, et al. (1999) for getting an estimate of initial value of capital stock. This procedure involves the following steps:
Step 1: The gross real investment (It) has been obtained by using relationship:
It = (Bt – Bt-1 + Dt) / Pt …(2)
Where
Bt = Book value of fixed capital in the year t;
Dt = Value of depreciation of fixed assets in the year t; and
Pt = Price index of machinery and machine tools in the year t.
Following Unel (2003) we have assumed the annual rate of discarding of capital or depreciation equals to five per cent.
Step 2: The logarithm of gross real investment was first regressed against a time trend to obtain its average growth rate ω and a trend value of investment at the beginning of the same, i.e., I0.
Step 3: Making the conventional assumption that the capital stock grows at a steady state at time t0 the value of capital stock for initial year (K0) has been then estimated as:
K 0 = I 0 + …(3)
Where
K0 = Gross value of initial capital stock;
ω = Estimated growth rate of investment; and δ = Annual rate of discarding of capital.
In the present analysis, following Unel (2003) we have taken annual rate of discarding of capital equal to five per cent.
Step 4: After obtaining the estimate of fixed capital for the benchmark year, the following equation has been used for the measurement of gross fixed capital series at 2011-2012 prices:
Kt = Kt-1 + It – δKt-1 …(4)
Where
Kt = Gross fixed capital at 2011-2012 prices by the end of year t; It = Gross real investment in fixed capital during the year t; and δ = Annual rate of discarding of capital.
All the above variables has been deflated with 2011-2012 as prices using appropriate price deflators. After obtaining gross value added at constant price, gross fixed capital at constant prices and total employees we followed Ray (2002) and Kumar (2003) and divided these variables by the total number of factories in Indian pharmaceutical industry. This step provides us GVA at constant prices per factory, Gross Fixed Capital at constant prices per factory and total person engaged per factory in Indian Pharmaceutical Industry (ASI).
Construction of Environmental Variables
The inter-temporal variations in capacity utilization of Indian pharmaceutical industry may occur due to various factors such as access to technology, structural rigidities, differential incentive systems, level of profitability, etc. In applied research, we often rely on regression analysis to examine the influence of environment factors on capacity utilization of the industry. Therefore, a set of environmental factors that have been used to explain variations in capacity utilization in Indian pharmaceutical industry, includes capital intensity (K/L), profitability (RETURN), share of capital (CS) and proportion of non-production employees to total employees (SKILL).
Measurement of Capital Intensity (K/L)
“The variable capital intensity (K/L) can be defined as gross fixed capital (i.e., capital in place) per employee. It is used as a measure of the relative degree of mechanization in the production process. We are not certain about the direction of relationship between capacity utilization and (K/L). On the one side, high capital intensity signifies modernization in the production process which can increase the CU of Indian pharmaceutical industry, whereas on the other, if the increased capital per man remains underutilized owing to some other causes, the excess capacity will increase and the increased excess capacity will further enhance technical inefficiencies. Therefore, it has been hypothesized that capital intensity variable may have either a positive or negative influence on capacity utilization” (Kumar 2001).
Measurement of SKILL
“The variable SKILL represents the availability of human skills and highlights the availability of the trained manpower including supervisory, administrative and managerial staff. Following Ghosh and Neogi (1993) and Kumar and Arora (2007), it was measured as the ratio of skilled persons (i.e., all employees minus production workers) to all employees” (Kumar 2001). In the present study, it has been hypothesized that SKILL affects the capacity utilization levels positively.
Measurement of Profitability (RETURN)
“The variable RETURN is defined as the ratio of contribution of capital to gross fixed capital. The contribution of the capital has been worked out by subtracting emoluments from gross value added. The variable RETURN is used as a proxy for the level of profitability in the industry. We hypothesize that profitability has a positive relationship with the Capacity Utilisation of Indian pharmaceutical industry, i.e., higher profitability acts as an incentive to exploit the available capacity up to its optimum extent, and vice-versa” (Kumar 2001).
Measurement of Factor Shares (Share of Labour and Capital)
“The share of labour (SL) has been obtained by the ratio of the total emoluments to gross value added. By assuming constant returns to scale, the share of capital input has been worked out as one minus share of labour, i.e., SK = (1 – SL)” (Kumar 2001). These factor shares have been calculated in order to analyse the impact of environment factors on capacity utilization in Indian Pharmaceutical Industry with reference to Kumar 2001.
Production Structure: Concept and Measurement
A production function is a mathematical statement which describes the technological relationship between inputs and output in physical terms or it is the functional relationship which presents the transformation of physical inputs into physical outputs. It also presents the quantitative relationship between quantity of inputs and output. “The production function is the name given to the relationship between the rates of input of productive services and the rate of output of product. It is economist’s summary of technological knowledge” (G.J. Stigler 1953). “More precisely the production function states the maximum quantity of output that can be produced from any given amount of various inputs per period of time or it states that the minimum quantity of various inputs that are required to yield a given quantity of output per period of time, technology being assumed to be remain constant. It is important to note that when a change in technology occurs such as introduction of a new technology or the substitution of skilled labour for unskilled labour then we will get a new production function” (Ahuja 2014).
Moreover, the present study attempts to estimate different components and parameters of the technical change with the use of the production function approach. A production function captures the relationship between the outputs obtainable from a given set of inputs at a specified stage of technical change. The present study restricts itself to use the translog production function… In algebraical form, production function can be represented as:
Q = f(K,L) …(5)
Where, Q is the output of the industry, K is the quantity of the capital employed and L is the quantity of labour employed.
Transcendental Logarithmic (Translog) Production Function
The production structure in the Indian pharmaceutical industry has been analysed with the help of Translog production function. The term “Translog production function”, abridged from “transcendental logarithmic production function “which was proposed by Christiansen, Jorgenson and Lau in their two papers published in 1971 and 1973, which dealt with the problems of strong separateness and homogeneity of Cobb-Douglas and CES production functions and their implications for the production frontier. Therefore, the Translog production function has been developed by Christensen, Jorgenson and Lau (1973). The Translog production function is conceptually simple and imposes no a- priori restrictions on elasticities of substitution and returns to scale; hence its wide use in empirical analysis. The translog production function has been used to examine input substitution (Berndt and Christensen, 1973), separateness and aggregation (Denny and Fuss 1977), technical change and productivity growth (May and Denny 1979), and productive efficiency (Greene 1980). “The Translog production function specification is a flexible functional form imposing relatively few a-priori restrictions on the properties of the underlying technology. It allows for variable elasticity of substitution (VES), variable scale elasticity and non-neutral technological progress. Homotheticity, separateness and CRTS can be imposed by testable restrictions on the parameters, and the form reduces to the multiple input Cobb-Douglas specification as a special case” (Kumar 2001). The Translog production function with n inputs and general factor-augmenting technical progress takes the form:
1 2
LnY = β0 + β1t + βKLnK + βLLnL + ( ) βKK(lnK) + βKLknK. lnL + βKtt. LnK + +βLtt. LnL + βtt(t)2
LnY = β + β t + β t2 + ∑m β LnX 1 ∑m ∑m β LnX LnX + 0 1 tt k=1 k k 2 k=1 j=1 kj k j m k=1
βkt(Ln. XK)t + μt − υt …(6)
Where, Y is index of output, ‘Xk’ represents the ‘kth’ input, t is time variable allowing non-neutral technological change and β’s are the parameters of the production function. ‘μt’ is assumed to be independently and identically distributed normal, random errors, having zero means and unknown variance and ‘υt’ is technical inefficiency. “The Translog production function specification is a flexible functional form imposing relatively few a-priori restrictions on the properties of the underlying technology. Also, it does not assume a Hicks-neutral or a constant rate of technological change and the elasticity of substitution between inputs is allowed to vary with the level of inputs” (Kumar 2001). Moreover, in the specification of Translog production function, the elasticity of output with respect to inputs and capital are not constant as in Cobb-Douglas production function and the change depends on the levels of input and time. The elasticity of output of each variable input is:
δlnY
δlnL = β βLL . lnL + βLK . lnK + βLt . t …(7)
δlnY
δlnK = β βKK . lnK + βLK . lnL + βKt . t …(8)
δlnY
δlnXk = β ∑k βkj LogXj + βktt …(9)
Since elasticity of output as well as factor shares vary with input levels in the Translog production function, the elasticity of substitution is also a function of input levels and is not a constant. The expression for the rate of technical progress in a Translog production function is given a
δln δ t = βt βtt . t + βKt . lnK + βLt . lnL …(10)
Where βt is the rate of autonomous technical progress (TFPG), βtt is the rate of change in technical progress and βLt and βKt define the bias in technical progress. If both βLt and βKt are zero, the technical progress is the Hicks-neutral type. If βKt is positive, the share of capital increases and there is capital using bias.
“The estimation of the stochastic frontier translog production function made it possible to verify whether the deviation in technical efficiencies from the frontier output is due to industry specific factors or due to external random factors.” The estimates of the parameters of the Translog production function are generally obtained either by ‘Ridge Regression technique’ or ‘OLS’ technique and indirect estimation of share equations by Zellner’s Seemingly Unrelated regression estimations (SURE) method” (Kumar, 2001)
“The translog production functions represent in fact a class of flexible functional forms for the production functions” (Ch. Allen, St. Hall 1997). “One of the main advantages of the respective production function is that, unlike in case of Cobb- Douglas production function, it does not assume rigid premises such as: perfect or “smooth” substitution between production factors or perfect competition on the production factors market” (J. Klacek, et. al. 2007). Also, the concept of the translog production function permits to pass from a linear relationship between the output and the production factors, which are taken into account, to a nonlinear one. Due to its properties, the translog production function can be used for the second order approximation of a linear-homogenous production, the estimation of the Allen elasticities of substitution, the estimation of the production frontier or the measurement of the total factor productivity dynamics. “Moreover, one significant drawback of Translog production function specification is that it is not globally well behaved in the sense that monotonicity and quasi-concavity conditions may not be satisfied globally. A production function is well behaved if it has positive marginal product for all inputs and is quasi-concave. The condition of positive marginal products or positive monotonicity requires that (δY/δXk)˃0. The quasi-concavity condition requires the Boarded Hessian matrix to be definite negative. It is to note that Translog production function will not possess these properties at all points. However, if a range of data points can be found for the inputs and output where the properties do hold, the function can be considered well behaved and provides a good representation of underlying production technology” (Kumar 2001).
In Translog production function, where at least one βkj ≠ 0, where k and j refers to the inputs, there exist configuration of inputs such that neither monotonicity nor concavity is satisfied, following simply the quadratic nature of the translog production function, the concavity can be assured if constant returns to scale are imposed and own share elasticities are non-positive. If translog production function is well behaved, it is possible to explore its characteristics with respect to homotheticity and constant return to scale. However, it is also possible to impose homotheticity and constant return to scale by testable restrictions on the parameters. The homotheticity implies that marginal rate of substitution between labour and capital is constant at constant capital-labour ratio. Therefore, the optimal factor proportions are independent of scale. In translog production function, the condition for homotheticity is given as:
βLL + βLK = 0 and β KK + βLK = 0 ∑k βkj = 0 …(11)
In addition to the restriction of homotheticity, the Translog production function also requires the restriction of constant return to scale, which is given as:
βK + βL = 1 ∑ βk = 1 …(12)
The translog production function reduces to Cobb-Douglas production function if:
βkj = 0 for all k and j …(13)
Capacity Utilization: Concept and Measurement
“Capacity is a short-run concept, for which firms and industry face short-run constraints, such as the stock of capital or other fixed inputs, existing regulations, the state of technology and other technological constraints” (Morrison 1985). However, measuring the rate of capacity utilization requires identifying the capacity output, i.e., Y* and then, the capacity utilization rate is defined as the ratio of the actual output Y0 to capacity output” (Kirkley, et. al. 2002), which can be written as:
CU = Y0/Y* …(14)
However, the notion of capacity output has been defined in two alternative ways; i) primal-technology based or engineering concept; and ii) an economic based concept. Moreover, capacity utilization is usually defined as the ratio of actual output to some measure of potential output. Two dominant approaches exist in the literature to measure potential output which includes technological approach and economic approach. As per the primal-technology based engineering concept, “the (weighted) average of the ratios between the actual output of firms to the maximum that could be produced per unit of time, with existing plant and equipment or the potential output may be technologically derived and hence defined relative to the maximum possible physical output that the fixed inputs are capable of supporting when the variable inputs are fully utilized” (Johanson 1968). “Alternatively, full capacity output is that level of output which the existing stock of equipment is intended to produce under normal conditions with respect to the use of variable inputs” (Smithies 1957). On the other hand, economic concepts measure the full capacity output of the firm at the point where average cost is minimum (Chamberlin 1947). Thus, from the point of view of an economist, the potential output can be defined relative to an economic optimum such as the level of output, which minimizes cost or maximizes revenue or profits (Gréboval and Munro 1999).
Capacity Utilisation Measurement Based on Data Envelopment Analysis (DEA)
In the present study, the Production Frontier based data envelopment analysis (DEA) method has also been preferred to develop a Capacity Utilisation index for analysing the inter-temporal variations in CU of Indian Pharmaceutical Industry. Because it does not require any pre-supposition regarding the technical nature of production or cost functions (i.e., Cobb-Douglas, CES or Translog, etc.). “DEA is a mathematical programming approach for estimating the relative technical efficiency (TE) of production activities. The term DEA was originally proposed by Charnes, et. al. (1978). The Charnes, et. al. work extended the Farrell (1957) multiple input, single output measure of technical efficiency to the multiple- output, multiple input technology. Since the early Charnes, et. al. work, however, DEA has developed and expanded to include a wide variety of applications. DEA has been used to assess technical efficiency, scope, scale, and allocative efficiency. It has also been used to estimate optimal input utilization, productivity, identify strategic groups, determine benchmarks and total quality management programs, estimate social and private costs of regulating undesirable outputs and capacity” (Kirkley, et. al. 2000). “The DEA models have been extended from the static, deterministic models to include dynamics and stochastic aspects” (Fare and Grosskopf 1996, Banker 1990, and Resti 2000). “The DEA approach derives a deterministic production frontier describing the most technically efficient combination of outputs, given the state of technology, fixed and variable inputs. The DEA approach calculates capacity output, given the variable factors are unbounded and fixed factors, and state of technology constraint output. Capacity output corresponds to the output that could be produced, given full and efficient utilization of variable inputs and given the constraints imposed by the capacity base, i.e., the fixed factors, the state of technology, environmental conditions and resource stock. In practice, because the data reflect both technological and economic decisions made by the firm, the variable inputs correspond to full and efficient utilization under normal operating conditions” (Färe, et. al. 1989). The mathematical model to compute capacity measure, proposed by the Färe, et. al. (1994) can be defined as follows:
Maximize θt …(15)
(θt , λ, μ)
Subject to:
θtyt ≤ λ’Y,
xtm ≥ λ’ Xm, m \ϵ Fx μtn xtn = λ’ Xn, n ϵ Vx λ, μt ≥ 0
“Where, θt = capacity measure at time t. Assume there are ‘m’ fixed inputs, ‘n’ variable inputs and ‘k’ outputs, then xtm, xtn and ytk are denotes as fixed input, variable inputs and output for tth year respectively. Thus, xtm is a (m×1) column vector, xtn is a (n×1) column vector and ytk is a ( k ×1) column vector. Moreover, Xm = (x1, x2,….. xt) is the (m×T ) matrix of fixed inputs, Xn = (x1, x2,….. xt) is the (n×T) matrix of variable inputs and Y= (y1, y2, yt) is the k ×T output matrix.
Further, λ is vector of intensity variable of order T ×1 and μtn represents input utilization rate of variable input ‘n’ at time ‘t’ and defined as the ratio of the optimal use of each input to its actual usage. “However, Capacity Utilization (CU) generally refers to the proportion of potential capacity that is used, and is typically measured as the ratio of actual output to capacity output” (Kirkley and Squires 1999). This ratio cannot exceed unity” (Färe, et. al. 1989). Färe, et. al. (1989) proposed that CU be measured as the ratio of output oriented technical efficiency to the capacity measure, i.e.
(CUDEA)t = ϕt / θt …(16)
Where, ‘ϕt’ represents technical efficiency score for the selected industry at time ‘t’ and θt denotes capacity measure for the selected industry at time ‘t’. The ‘ϕt’ can be defined from the following model which is popularly known as output- oriented CCR model.
Maximise ϕt …(17)
(θt, λ)
Subject to θt yt ≤ λ’Y, xt ≥ λ’X,
λ ≥ 0
In model (17) the output constraint is same as given in model (15) whereas, the handling of input constraints differs to some extent. In model (17), each input acquires same treatment and no differences exist between fixed and variable inputs. Thus, X = (x1, x2,….. xT) becomes a matrix of order {(m + n)×T}. It is evident from relation (16) that capacity utilization and technical efficiency are related with each other. We made use of relationship (16) to compute the levels of capacity utilization in Indian pharmaceutical industry. The data on the above mentioned selected variables were analysed empirically and results were interpreted accordingly.
II Empirical Results
The maximum likelihood technique has been used to estimate the different variants of the stochastic frontier production function. The empirical analysis based on the econometric technique shows that the Cobb-Douglas production function with Hicks-neutral technical progress is not appropriate in case of Indian pharmaceutical industry. Therefore, it has been observed that the translog production function with capital using non-neutral technological progress represents the technological relationship in Indian pharmaceutical industry. Assuming the transcendent logarithmic translog production function, the estimated parameters of the production frontier and estimates of the technical efficiency are presented in table 1.2 and 1.3 respectively Table 1.1 shows the empirical results pertaining to the estimates of the elasticities of mean output with respect to labour, capital and rate of technical progress to the tune of 17.09, 19.38 and -0.49 respectively. Therefore, the estimated results of a translog stochastic production frontier show that the coefficients of labour and capital have expected positive signs. The positive and highly significant coefficients confirm the expected positive and significant output effects of labour and capital. The empirical findings suggest that one per cent increase in the labour input or employment leads to 17.09 per cent increase in output of the Indian pharmaceutical industry and 1 per cent increase in the capital inputs leads to 19.38 per cent increase in the output of Indian pharmaceutical industry.
Moreover, the elasticity estimates of labour and capital are statistically significant at 1 per cent level of significance. In contrast, the squared variable of labour [(ln L)2] is negative and statistically significant at a five per cent level, which indicates a diminishing return to labour input. The same is also true for the squared capital. Its estimated coefficient, while negative, turns out to be statistically significant at 1 per cent level, where it also indicates the diminishing returns to capital input. Furthermore, the estimated coefficient of the interacting variable between labour and capital (ln L* ln K) is negative and significant at a 10 per cent, suggesting a little substitution effect between labour and capital. Moreover, for time variables, coefficients of time (T) is negative and statistically significant at five per cent level whereas its square are negative and statistically insignificant. A non-neutral technological progress toward capital is indicated by a positive and statistically significant (at 10 per cent level) coefficient of the interacting variable between time and capital (T * ln K). Moreover, the empirical analysis suggests that the return to scale seems to be constant return to scale.
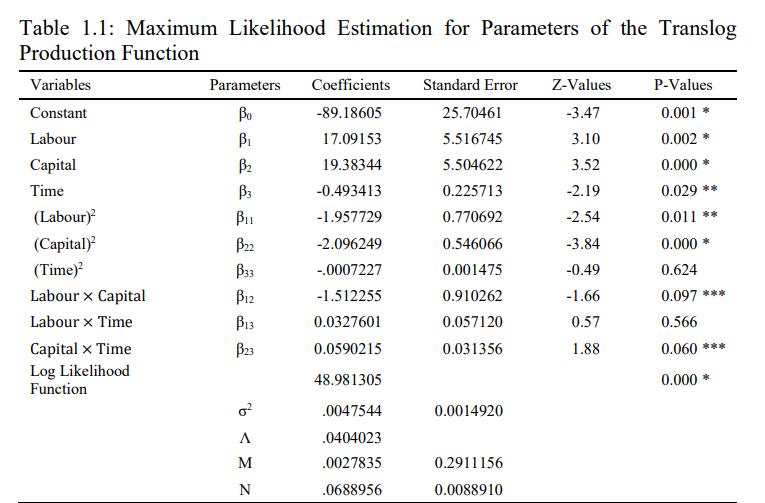
Note: *, ** and *** indicates the level of significance at one per cent, five per cent and 10 per cent respectively. Source: Author’s Calculations.
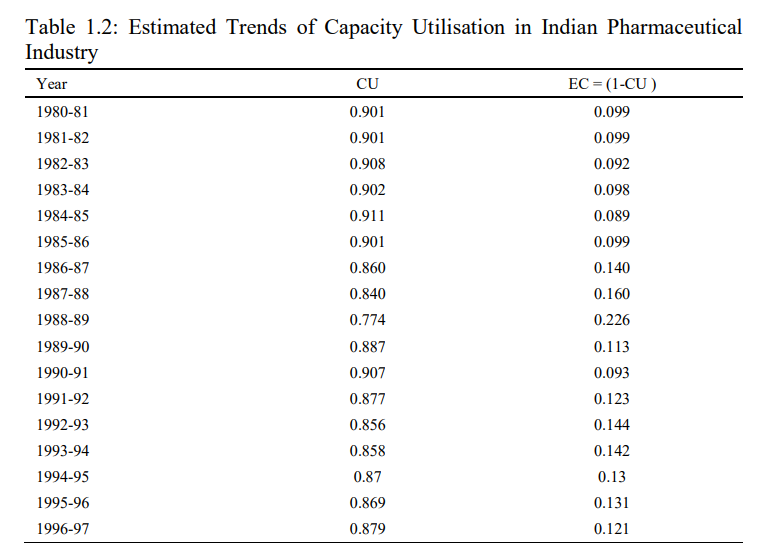
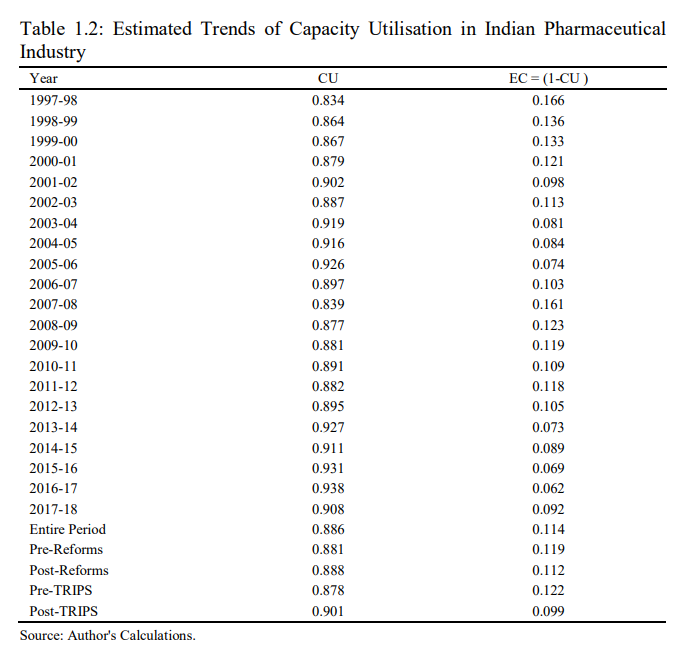
Moreover, this section also presents the empirical results pertaining to the inter-temporal variations in the trends of capacity utilization in Indian pharmaceutical industry during 1980-1981 to 2017-2018, which has been further divided into four sub-periods i) Pre-reforms 1980-1981 to 1990-1991; ii) Post- Reforms 1991-1992 to 2017-2018; iii) Pre-TRIPS 1980-1981 to 2004-2005 and
iv) Post-TRIPS period 2005-2006 to 2017-2018. Table 1.2, shows the trends of capacity utilization and excess capacity in Indian pharmaceutical industry during 1980-1981 to 2017-2018. The result shows that the capacity utilization in Indian pharmaceutical industry has varied between maximum of 93.8 per cent (0.938) and minimum of 77.4 per cent (0.774), whereas the average CU during the entire study period is recorded to the tune of 88.6 per cent (0.886). The average CU reveals that in each year of the study, the level of CU, on an average, is about 88.6 per cent in Indian pharmaceutical industry. Therefore, the average amount of excess capacity is about 11.4 per cent in Indian pharmaceutical industry during the entire study period. The inter-temporal analysis of CU in Indian pharmaceutical industry indicates that the maximum CU has been observed in year 2016-2017 to the tune of 93.8 per cent, whereas the Indian pharmaceutical industry has experienced the minimum CU to the amount of 77.4 per cent during 1988-1989.
The comparative analysis of CU during the pre-reforms and post-reforms period reveals that the average capacity utilization in Indian pharmaceutical industry has experienced a minute increase in the post-reform period, as it has increased from 88.1 per cent (in Pre-Reforms period) to 88.8 per cent during the post-reforms period. Moreover, in order to examine the impact of TRIPS agreement on capacity utilization in Indian pharmaceutical industry the entire period has been divided into Pre-TRIPS and Post-TRIPS period. The empirical result reveals that capacity utilisation in Indian pharmaceutical industry has increased from 87.8 per cent in the pre-TRIPS period to 90.1 per cent during the post-TRIPS period. It is to be concluded from the comparative analysis that both the economic reforms of 1991 and implementation of TRIPS agreement has a favourable impact on the capacity utilization in Indian pharmaceutical industry. Therefore, the economic reforms of 1991 s integrated the Indian economy with world economy and it modernised the technological know-how and improvement in the skill of the labour force which further helped to reduce the inefficiencies and in-turn the optimum allocation and utilisation of input resource are major factors responsible for improvement in CU in Indian pharmaceutical industry.
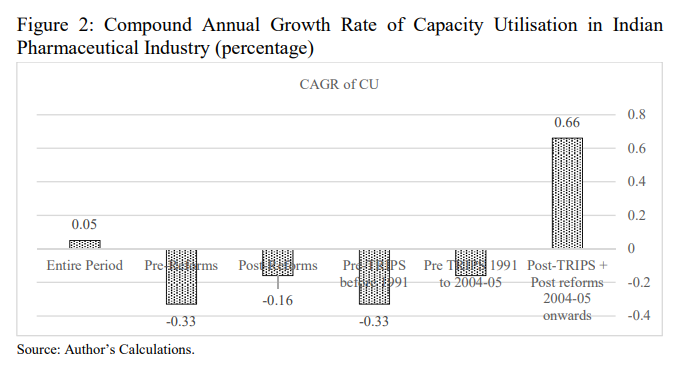
Further, the implementation of more rigorous TRIPS agreement has a favourable impact on the capacity utilisation in Indian pharmaceutical industry, because in the post-TRIPS regime the increase in research and development expenditure and global competitiveness leads to decline in the waste of input resources and enables the Indian pharmaceutical industry to utilize its potential capacity. In addition to this, the perusal of Compound Annual Growth Rate (CAGR) of capacity utilization during the entire study period is presented in Fig
- The analysis shows that the CAGR of capacity utilization during the entire study period is observed to be 0.05 per cent. On the one hand, the comparison of CAGR of CU levels during the Pre-reforms and Post-reforms reveals that the growth of capacity utilization increased in the post-reforms period. Here, it is to note that the capacity utilization declined at a rate of -0.16 per cent in the post-Reforms period up to 2004-2005 in comparison to -0.33 per cent in the pre-reforms period. On the other hand, the analysis of the comparison of CAGR of CU levels during the Pre- TRIPS and Post-TRIPS indicates that growth rates of capacity utilization increased in the post-TRIPS period along with post-reforms period to the tune of 0.66 per cent, whereas the CU level declined at -0.33 per cent during the pre-TRIPS period up to 1991 and -0.16 up to 2004-2005. In the nutshell, we can safely infer that the excess capacity in Indian pharmaceutical industry declined in the Post-Reforms and Post-TRIPS period
III Factors Affecting Variations in Capacity Utilization
In the above analysis, the inter-temporal variations in CU of Indian pharmaceutical industry have been observed. However, there are various factors which are responsible for the variations such as access to technology, structural rigidities, differential incentive systems, level of profitability, etc. “In applied research, we often rely on regression analysis to examine the influence of environment factors on capacity utilization. Unfortunately, the simple linear regression model is not appropriate in the present context, because the range of CU levels (dependent variable) is (0,1), therefore, estimation of the model using ordinary least square procedure may produce biased estimates if there is a significant position of the observations equal to one” (Resende 2000). “In such cases, the appropriate regression model is known as a Tobit or Censored regression model which handles data that is skewed and truncated” (Avkiran 1999).
The Tobit model is a statistical model proposed by James Tobin (1958) to describe the relationship between a non-negative dependent variable yi and an independent variable xi. The model supposes that there is a latent (unobservable variable) yi. This variable linearly depends on xi via a parameter (vector) β which determines the relationship between the independent variable (or vector) xi and the latent variable yi (just as in a linear model). In addition, the error term ei is normally distributed to capture random influences on this relationship. The observable variable yi is defined to be equal to the latent variable whenever the latent variable is above zero and zero otherwise.
yi = y * (if y > 0) yi = 0 ( if yi ≤ 0 ) N N 𝑦∗ = Σ 𝛼j𝑧ij+ Σ 𝛽j𝑥j + 𝜀it …(18)
it j=1 it j=1 𝑦it = 𝑦∗ , 𝑖𝑓, 𝑦∗ < 1, 𝑎𝑛𝑑 it it
𝑦it = 1, 𝑜𝑡ℎ𝑒𝑟𝑤𝑖𝑠𝑒 Where zij = 1 if i = j 2 ‘0’ otherwise and it IIN (0, 𝜎2)
However, 𝑥j represent the jth explanatory variables and j are corresponding parameters. The 𝑦∗ is a latent variable and yit is the dependent variable. The joint probability function or likelihood function can be written as:
∞ T 𝑦iT 𝑓 [(𝑦 . . . . . . 𝑥 , 𝑧 . . . 𝑧 ) , ( , )] = ƒ G 𝑓(𝑦 /𝑥 , 𝑧 , 𝛼 , 𝛽 )𝑑 𝜀 i1 𝑥i1 iT i1 iT j j –∞ t it it ij j j it 𝑦 1
–1(yit–∑N ajzij— ∑k βjxij)2 𝑓 [it , (𝛼 , 𝛽 )] = 𝑒 2 σ2 𝑖𝑓 𝑦 𝑥it,
𝑧it j j N √2𝜋𝜎2 k s it<1 Σ 𝛼j𝑧ij+ Σ 𝛽j𝑥j 𝑎𝑛𝑑 = ∅ ⎢⎣ j=1 𝜎e j=1 𝑖𝑓 𝑦it = 1 ⎦
Further, the Random effects panel data Tobit model can be written as
k 𝑦∗ Σ 𝛽j𝑥j + 𝜇i + 𝑣it it= .it j=1 …(19)
𝑦it = 𝑦∗ 𝑦∗ 𝑦it = 1 𝑜𝑡ℎ𝑒𝑟𝑤𝑖𝑠𝑒
it,if it 1 and
𝑊ℎ𝑒𝑟𝑒 𝜇i = 𝐼𝐼𝑁 (0, 𝜎2) 𝑎𝑛𝑑 𝑣
= 𝐼𝐼𝑁 (0, 𝜎2) are assumed to be independent of
xi1 , xiT, using f as generic notation for a density or probability mass function the
likelihood function for model ‘19′ can be written as
∞ T
𝑓(𝑦i1…𝑦it/𝑥i1 … 𝑥it), 𝛽j) = ƒ G 𝑓(𝑦it/𝑥it, 𝜇i, 𝛽j)𝑓(𝜇i)d𝜇i –∞ t 𝑓(𝜇 ) = 1 𝑒 √2πσ2 — 1 µ2 2 σ2 , …(20)
and 𝑦 1 𝑓 [( ) , (𝜇 , 𝛽 )] = 𝑒 –1(yit–∑kβjxj –μi)2 σ2 𝑖𝑓 𝑦 𝑥it i j √2𝜋𝜎 v it<1kΣ 𝛽j𝑥j + μi = ∅ j=1 ⎢ 𝜎v ⎥ ⎣ ⎦ 𝑖𝑓 𝑦it = 1
In the present study, capital intensity (K/L), profitability (RETURN), proportion of non-production employees to total employees (SKILL) and share of labour (SL) have been used as explanatory variables to explain the variations in capacity utilization in Indian pharmaceutical industry.
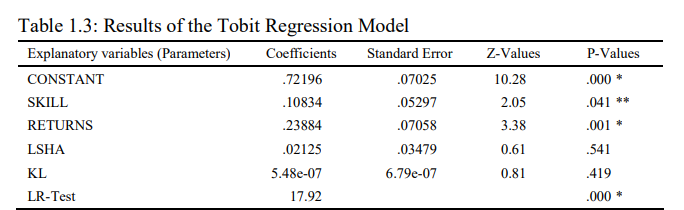
Notes: i) * and ** represents the level of significance at one per cent and five per cent respectively; ii) LR test stands for the Likelihood-Ratio Chi-square test.
Source: Author’s Calculations.
Table 1.3 presents the Tobit regression results. The result shows that the explanatory variables SKILL and RETURNS are significantly affecting the Capacity Utilisation levels in Indian Pharmaceutical industry. However, both the variable SKILL and RETURNS bears a sign in agreement with a-priori expectations, and thus found to be positively affecting capacity utilization in Indian pharmaceutical industry. The direct connotation of this result is that with the increase in profitability and availability of more skilled employees leads to increase in capacity utilization and optimum utilization of the potential capacity in Indian pharmaceutical industry. Therefore, the empirical analysis suggests that the efforts must be taken to enhance the profitability and skill of labour force to realize the full capacity utilization in Indian pharmaceutical industry. Moreover, a positive and a statistically significant coefficient of RETURN supports our inference about the positive impact of it on CU levels in Indian pharmaceutical industry. Therefore, unskilled labour force and low returns are major reasons for excess capacity in Indian pharmaceutical industry. Further, the share of labour and capital intensity did not show any significant impact on the capacity utilization in Indian pharmaceutical industry. However, the likelihood ratio chi-square of 17.92 with a p-value of 0.000 tells us that our model as a whole is significantly fit.
IV Conclusion
The present study aims to analyse the production structure and the inter-temporal variations in capacity utilization in Indian pharmaceutical industry during 1980- 1981 to 2017-2018. The maximum likelihood technique has been used to estimate the different variants of the stochastic frontier production function. The empirical analysis based on the econometric technique shows that the Cobb-Douglas production function with Hicks-neutral technical progress is not appropriate in case of Indian pharmaceutical industry. Therefore, it has been observed that the translog production function with capital using non-neutral technological progress represents the technological relationship in Indian pharmaceutical industry. The estimates of capacity utilization have been computed by applying the linear programming based Data Envelopment Analysis (DEA). The empirical analysis reveals that the Indian pharmaceutical industry is operating with an average excess capacity to the tune of 11.4 per cent during the entire study period. However, the comparative analysis of capacity utilization during the pre-reforms and post- reforms period reveals that the average excess capacity marginally declined in the post-reforms period by about 0.50 per cent. Moreover, it has also been observed that capacity utilisation in Indian pharmaceutical industry increased from 87.8 per cent in the pre-TRIPS period to 90.1 per cent during the post-TRIPS period. Therefore, the excess capacity in Indian pharmaceutical industry decreased from 12.2 per cent in pre-TRIPS period to 9.9 per cent during the post-TRIPS period. Thus, it is to be concluded from the comparative analysis that both the economic reforms and implementation of TRIPS agreement have a favourable impact on the capacity utilization in Indian pharmaceutical industry.
The economic reforms abolished the licensing rules which encouraged the new entrants and growth of demand in the globalised regime has induced the existing pharmaceutical firms to expand and utilize their potential productive capacity to the optimum level which leads to a favourable impact on CU in Indian pharmaceutical industry. In order to enhance the capacity utilisation in the Indian pharmaceutical industry both capital and labour inputs be used judiciously especially in view of the post-TRIPS regime. Therefore, it can be inferred that in the era of globalization Indian pharmaceutical industry has to comply with strict business standards and boost the level of investment in the Research and Development activities in order to expand and utilize the potential capacity during the post-TRIPS regime. The main limitation of the study is that the capacity utilization can be measured approximately and not exactly which should be kept in mind before policy formulation. Since, DEA is an extreme point technique, noise such as measurement error can cause significant problems. Moreover, despite the theoretical superiority of the Tobit model to classical statistical techniques, the researchers must be cautioned to care of its limitations. Further, an analysis both at state level and at firm level for Indian pharmaceutical industry can be done and incorporated into the present analysis.
Affiliation
Jaswinder Singh, Assistant Professor in Economics, Khalsa College for Women, Amritsar 143001, Punjab, Email: judgeaulakh1313@gmail.com.
Kawaljeet Kaur Assistant Professor in Economics, Punjab School of Economics, Guru Nanak Dev University, Amritsar 143005, Punjab, Email: kawaljeet1314@gmail.com
References
Agrawal, Pradeep and P. Saibaba (2001), TRIPS and India’s Pharmaceuticals Industry, Economic and Political Weekly, 36(39): 3787-3790, September 29.
Aigner, D.J., C.A.K. Lovell and P. Schmidt (1977), Formulation and Estimation of Stochastic Production Frontier Production Function Models, Journal of Econometrics, 6(1): 21-37.
Arora, Nitin (2010), Capacity Utilisation, Technical Efficiency and TFP Growth, Lap Lambert Academic Publishers, Germany
Avkiran, N.K. (1999), An Application Reference for Data Envelopment Analysis in Branch Banking: Helping the Novice Researcher, International Journal of Bank Marketing, 17(5): 206-220.
Bairam, E. (1990), Aggregate and Disaggregate Production Function Estimates for the Indian Economy using Annual Time Series and Cross Regional Data, The Indian Economic Journal, 38(2): 152-168.
Benerji, A. (1975), Capital Intensity and Productivity in Indian Industry, Macmillan Company, New Delhi, India.
Budhin, M. and S. Paul (1961), The Utilization of Indian Industrial Capacity: 1949-59, Indian Economic Journal, 9(1): 19-35.
Burange, L.G. (1992), The Trends in Capacity Utilization in the Indian Manufacturing Sector:1951- 1986, Journal of Indian School of Political Economy, 4(5): 445-455.
———- (1993), Implications of Full Capacity Utilisation of Manufacturing Sector in Indian Economy, Artha Vijnana, 35(2): 160-181.
Chamberlin, E. (1947), The Theory of Monopolistic Competition, 5th Edition, Cambridge: Harvard University Press.
Chandra, Saurabh (2013), Impact of Trips Over Indian Patent Regime Vis Avis Indian Pharmaceutical Industry, Galgotias Journal of Legal Studies, 1(1): 45.
Chaudhuri, S. (2002), TRIPS Agreement and Amendment of Patents Act in Indian, Economic and Political Weekly, 37(32): 3354-3360.
Coelli, T.J. (1996), A Guide to DEAP Version 2.1: A Data Envelopment Analysis (Computer) Program, Centre for Efficiency and Productivity Analysis (CEPA) Working Papers, No. 8/96, University of New England, Armidale, Australia.
———- (1996), A Guide to Frontiers Version 4.1: A Computer Program for Frontier Production and Cost Function Estimation, CEPA Working Papers 7/96 Department of Econometrics, University of New England, Armidale.
Divetia, V.V. and Ravi Verma (1970), Index of Potential Production and Potential Utilization Ratio for the Manufacturing Industries in India, Reserve Bank of India Bulletin, 25(4): 574-598.
Färe, R. (1984), On the Existence of Plant Capacity, International Economic Review, 25(1): 209- 213.
Färe, R., S. Grosskopf and C.A.K. Lovell (1996), Production Frontiers, Cambridge University Press, Cambridge, U.K.
Färe, R., S. Grosskopf and E.C. Kokkelenberg (1989), Measuring Plant Capacity, Utilization and Technical Change: A Nonparametric Approach, International Economic Review, 30(3): 655- 666.
Ghosh, B. and C. Neogi (1993), Productivity Efficiency and New Technology: The Case of Indian Manufacturing Industries, The Developing Economies, 31(3): 308-328.
Goldar, B. (2004), Indian Manufacturing: Productivity trends in Pre and Post-reform Periods,
Economic and Political Weekly, 39(46/47): 5033-5042.
Goldar, B. and V.S. Ranganathan (1992), Capacity Utilization in Indian Industries, The Indian Economic Journal, 39(2): 83-92.
Gréboval, D. and G. Munro (1998), Overcapitalization and Excess Capacity in World Fisheries: Underlying Economics and Methods of Control, Background paper prepared for Food and Agriculture Organization (FAO) Technical Working Group on the Management of Fishing Capacity, La Jolla, USA, 15–18 April 1998, pp. 160.
Gujrati, N. D. and Sangeetha (2007), Basic Econometrics, Tata McGraw Hill Education Private Limited, New Delhi.
Gulati, K.S. (1959), Engineering Industry in India- Their Capacity Utilization, The Economic Weekly, 11(19): 635-639.
Gupta, G.S. (1973), Production Function and Factor Productivity in the Indian Cement Industry,
Indian Journal of Industrial Relations, 8(3): 56.
Gupta, M. and M.J.K. Thavaraj (1975), Capacity Utilization and Profitability: A Case Study of Fertilizer Units, Productivity, 16(3): 882-892.
Karim, B. and B.T. Bhinde (1975), Capacity Utilization in Public Enterprises: Problems and Prospects, Productivity, 16(3-4): 875-881.
Kirkley, J., C.J.M. Paul and D. Squires (2002), Capacity and Capacity Utilization in Commonpool Resource Industries: Definition, Measurement and a Comparison of Approaches, Environmental and Resource Economics, 22(1-2): 71-97.
Kumar, S. (2001), Productivity and Factor Substitution: Theory and Analysis, Deep and Deep Publications, Pvt. Ltd., New Delhi.
———- (2003), Inter-Temporal and Inter-State Comparison of Total Factor Productivity in Indian Manufacturing Sector: An Integrated Growth Accounting Approach, Artha Vijnana, 45(3-4): 161-184.
———- (2005), A Decomposition of Total Productivity Growth: A Regional Analysis of Indian Industrial Manufacturing Growth, International Journal of Productivity and Performance Measurement, 33(3/4): 311-331.
Kumar, S. and N. Arora (2007), An evaluation of Technical Efficiency of Indian Capital Goods Industries: A Non-Parametric Frontier Approach, Productivity, 48(2): 182-197.
Morrisson, C.J. (1985), Primal and Dual Capacity Utilization: An Application to Productivity Measurement in the U.S. Automobile Industry, Journal of Business and Economic Statistics, 3(4): 312-324.
Ray, S. and M.K. Pal (2008), On the Measurement of Capacity Utilization: An Evidence from Indian Chemical Industry, Artha Vijnana, 50(2): 116-128.
Ray, S.C., K. Mukherjee and Y. Wu (2002), Direct and Indirect Measures of Capacity Utilization: A Nonparametric Analysis of U.S. Manufacturing, Working Paper No. 2005-36, University of Connecticut.
Resende, M. (2000), Regulatory Regimes and Efficiency in US Local Telephony, Oxford Economic Papers, 52(3): 447-470.
Seth, V.K. (1986), Capacity Utilization in Industries- Theory and Evidence, Deep and Deep Publications Pvt. Ltd., New Delhi, India.
Singh and Singh (2013), Structure and Growth Performance of Indian Pharmaceutical Industry in the Post-TRIPS Period: An Empirical Analysis, Journal of Economic Policy and Research, 9(1): 1-11, October 2013- March 2014.
———- (2014), Decomposition of Technical Efficiency and Productivity Growth in Indian Pharmaceutical Industry: A Non-Parametric Analysis, Artha Vijnana, LVI(4): 456-478, December.
———- (2015), Economic Growth and Exports of Indian Pharmaceutical Industry-An Empirical Analysis, Anvesak, 45: 75-88, January-June 2015.
Singh and Singh (2016), Economic Reforms and Partial Factor Productivity Analysis of Indian Pharmaceutical Industry, PSE Economic Analyst, XXXI(I): 41-60.
———- (2016), Globalisation and Performance Evaluation of Indian Pharmaceutical Industry: An Empirical Analysis, Unpublished Ph.D. Thesis submitted to Guru Nanak Dev University, Amritsar.
Unel, B. (2003), Productivity Trends in India’s Manufacturing Sectors in the Last Two Decades, IMF Working Paper No. WP/03/22, International Monetary Fund, Washington DC.