Special Economic Zones in India: Location and Land Utilisation
December 2023 | Surya Tewari
Introduction
Special Economic Zones (SEZs) were launched with the approval of theParliament of India in June 2005 – with much optimism – for generating growthand employment. There was also an idea of capping the number of SEZ to curblarge tracts of agricultural land from being converted to non-agricultural use. Thisled to the rush for setting up of SEZs in the country. In 2006, for example, 235SEZs were formally approved (Reddif, February 21, 2007). The rapid pace ofdemand for SEZ created fear of acquisition of fertile cultivable land therebyaffecting agricultural production. As a consequence, there was huge backlash fromactivists and political parties resulting in conflicts such as that in places likeNandigram in the state of West Bengal. Official data shows that most of the currently functional SEZs were notified between 2006 and 2009. Moreover, manyof them are not yet functional. Protests are also taking place for the return of unused land (The Hindu, October 1, 2018; The Times of India, February 14, 2021).
In fact, we have come to a time when the attraction of SEZs appears to bewaning in the country. The need for bringing new SEZ law is evidence of how thecurrent law and policy failed to meet out the hopes as envisioned (The Hindu,February 1, 2022). De-notification of SEZs is taking place which indicates loss ofinterest in the efficacy of SEZ. Going by the government’s account, by June 2017some 81 SEZs had been de-notified (The Indian Express, July 26, 2017). Reasonshighlighted for such a state include unsuitable location of SEZs, unviablerehabilitation and compensation package, imposition of Minimum Alternate Tax(MAT) and Dividend Distribution Tax (DDT), benefits outside SEZ like importduty concessions through various free trade agreements, and viability of size. Areason ignored in the preceding list of reasons is the quantum of land originallyapproved was more than what was required.
Available literature dealing with SEZs focus on issues like employment,export, investment, FDI, incentives, backward and forward linkages, sale todomestic tariff area, land acquisition, and compensation. See for example researchworks of Aggarwal 2007, Sharma 2007, Gill 2007, Sampat 2008, Sharma 2009,Rawat, Bhushan, and Surepally 2011, Pratap 2012, Aggarwal 2012, Khurud 2013,Shah 2013, Cook, Bhatta, and Dinker 2013, Mukherjee, et. al. 2016, Chakraborty,Gudimeda, and Kathuria 2017 and Sathe, 2017. Land as a factor of production hasnot been adequately explored in these publications.
It is pertinent to note that with focus on utilization of land, the efficiency ofexisting SEZs would increase. This in turn is critical for scaling up manufacturinggrowth and employment.
There are a few studies that consider SEZs as neo liberal mechanism toaccumulate more capital (land) in collusion with domestic system by the processof “dispossession” or “encroachment”. State is treated as “land broker,” developeras “land rentier,” with no role in real production but only a role in land circulation(See Levien 2011, Gopalkrishnan 2007 and Banerjee-Guha 2008 and 2017). Goingby their argument the location of SEZs in and around large urban areas (Mitra2007 and Mukhopadhyay and Pradhan 2009) may be regarded as nothing but anavenue to gain from land through speculation and concomitant wastage ofcompeting, scarce resource. We expect such wastage to get reflected in the extentof unused land in SEZs, extent of non-functional SEZs and the number denotifications of SEZs in the country. In this background the objectives set for thispaper are:
- Analysis of level of utilisation of land in SEZs,.
- Examination of factors affecting land utilisation – type of promoter, sector,
size, operational status, and locational attributes in terms of accessibility/land
quality, and - Investigation of both the additional and the de-notified SEZs
The analysis is carried out at all India level using secondary data. The paperis divided into seven sections. The following, Section II, explains the analyticalframework of the study. Section III analyses land distribution and utilisation.Section IV investigates additions and de-notifications of SEZs. Section V assessestime lag between notification and operation of existing SEZs. Section VI examinesthe locational aspect of existing SEZs in the country. Finally, Section VII sums upthe paper.
II Analytical Framework
The analysis is carried out using secondary data pertaining to SEZs as existing onJanuary 23, 2014, and December 01, 2017. Data was extracted from the websiteof the Government of India (GOI 2014, GOI 2017a and GOI 2017b). Data relatingto 2014 is used in Section III of the paper for analysing the level of land utilisationand its correlates. This was the only data available on land information viz.notified, utilised, and extent of vacant land in processing area of each of thenotified SEZ at the time of commencement of the work. In 2014, eighteen statesand two UTs had notified SEZs. From this list, the SEZs in Telangana have beenseparated from those in Andhra Pradesh (Telangana was formed on June 02,2014). The SEZs considered in the paper includes SEZs notified under SEZ Act2005 and 19 (18 in the list of 2017 on de-notification of the one in Jodhpur)EPZs/SEZs rechristened or set up respectively, before the introduction of SEZ Act2005.
The regression technique is utilized to investigate the factors impacting landutilization in SEZs with percentage land utilized in the notified area taken as adependent variable and predictors as developer, sector, size, operational status,accessibility, accessibility and land quality. With the exception of the last threevariables, the information for others is used directly from the database of January2014. The data of 2017 has been used to know the operational status of SEZs in2014. All the SEZs of 2014 are located in the list of operational SEZs of 2017. 78SEZs which were not there in the list of 2017, are considered as non-operationalin 2014. For locational aspects, the base maps from the study previously done byRamachandran and Biswas (2007) have been used. The authors have mapped andmeasured the accessibility of all the districts of the country simultaneously on fourparameters (a) areas within 10 km from the national highway, (b) areas within 30km from a broad-gauge railway line, (c) within 50–100 km of cities with apopulation of 1 million, and (d) within 30–60 km from cities with a populationabove three hundred thousand. To reflect land quality in accessible area,parameters of unproductive and scrub land were added. Districts that satisfy theconditions of accessibility and of accessibility in unproductive and scrub land areconsidered preferable for setting up the SEZs. While accessibility is importantfrom the perspective of the promoter of SEZ, land quality parameters take note ofthe environmental aspect. By superimposing districts that are preferable forlocation of SEZ and districts in which SEZs are located, two maps have been obtained with each showing two elements – SEZs located in preferred districts and those in unsuitable districts.
III Land Distribution and Its Utilisation
Despite substantial diversity and disparity in India across states, SEZ areestablished through a single Act on SEZ passed by the Parliament of India in 2005.Figure 1 records the distribution of SEZs by state across 21 states/union territories(UTs) of India.
Figure 1 reveals the following feature: 1) Majority of SEZs are located inMaharashtra, Telangana and Tamil Nadu. (2) The SEZs are mainly promoted bythe private sector. In many of the states, the share of private sector is high, reachingup to 100 per cent as in Punjab, Haryana, Uttarakhand, Chhattisgarh, Jharkhand,Nagaland, and Goa. However, except Haryana (having 29 SEZs), the number ofSEZs is low in all these states. (3) In three states – Kerala, Madhya Pradesh, andOdisha – the state government share is comparable with that of private SEZs. InKerala, most of the SEZs (72 per cent) have been developed by the stategovernment. This may be due to the fact that the state has categorically specifiedthat it is not going to make land available to private enterprises or undertakeacquisition on behalf of the private entity. The state also demands the processingarea to be 70 per cent (remaining 30 per cent as non-processing) of the notifiedland, plus it permits implementation of all prevailing labour related Acts in theSEZs.
Figure 1: Distribution of SEZs by Developers (as on January 23, 2014)
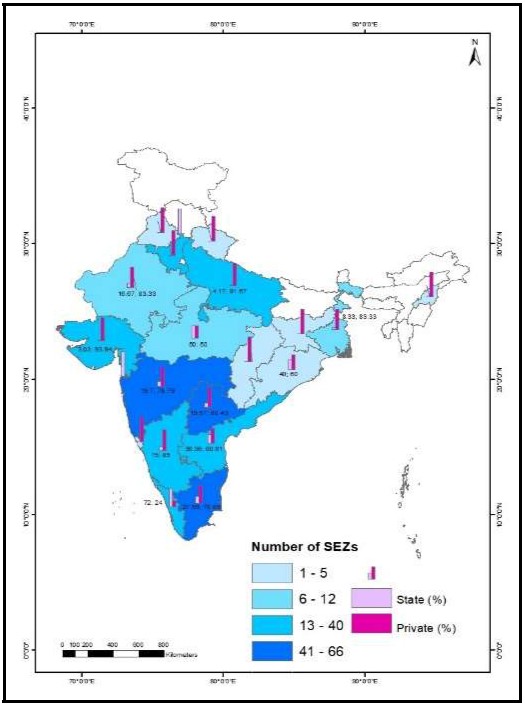
Figure 2: Distribution of Notified Area in SEZs by the Type of Developer (as on January 23, 2014)
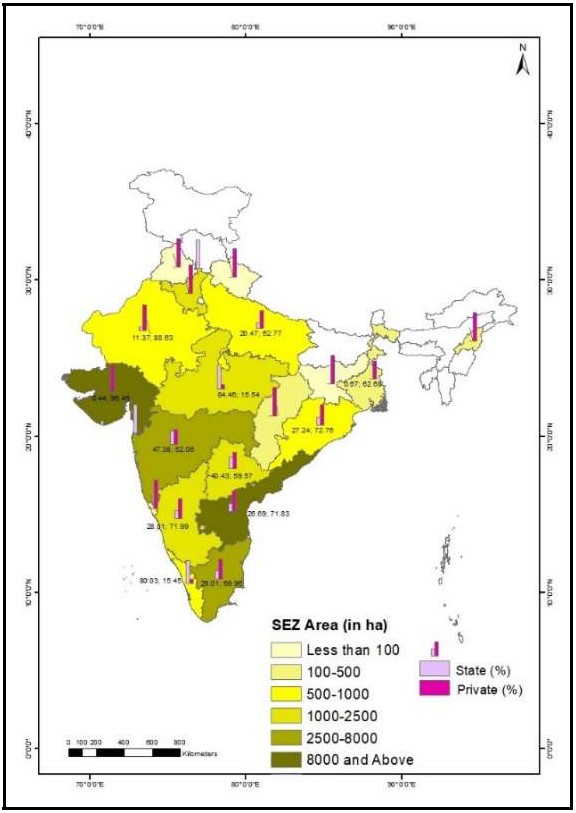
A study of Figure 2 brings out firstly, that the physical aggregate size of SEZs vary significantly across states- smallest aggregate being less than 100 ha to the biggest size of about 13,000 ha. The area in the biggest size bracket is in Gujarat and Andhra Pradesh. Both the states have the highest number of multiproduct SEZs in the country. Secondly, northern states have smaller SEZs in comparison to the southern states. Thirdly, in the southern states of Kerala, Karnataka, and Telangana, the size of the SEZ is comparatively smaller due to the fact that these are mainly in the IT/ITES sector. The minimum area requirement for this sector was 10 ha, a condition that was dispensed with subsequently. And, fourthly, since the share of private SEZs is generally more in each state, the area under private SEZs is also more. Privately developed SEZs account for about 76 per cent in terms of numbers and about 73 per cent in terms of area.
However, when it comes to utilisation of land (includes utilisation in processing and amenities), utilisation by privately developed SEZs is similar to state government SEZs (Table 1). Both have been able to utilise a little over 1/3 of the respective notified land. However, comparison at intra-state level reveal differences. The results of paired t test on 12 states (having both state and privately developed SEZs) show the difference to be significant (t=2.7889; p=0.018).
Table 1: Per cent Utilised Land to Notified Area (as on January 23, 2014)
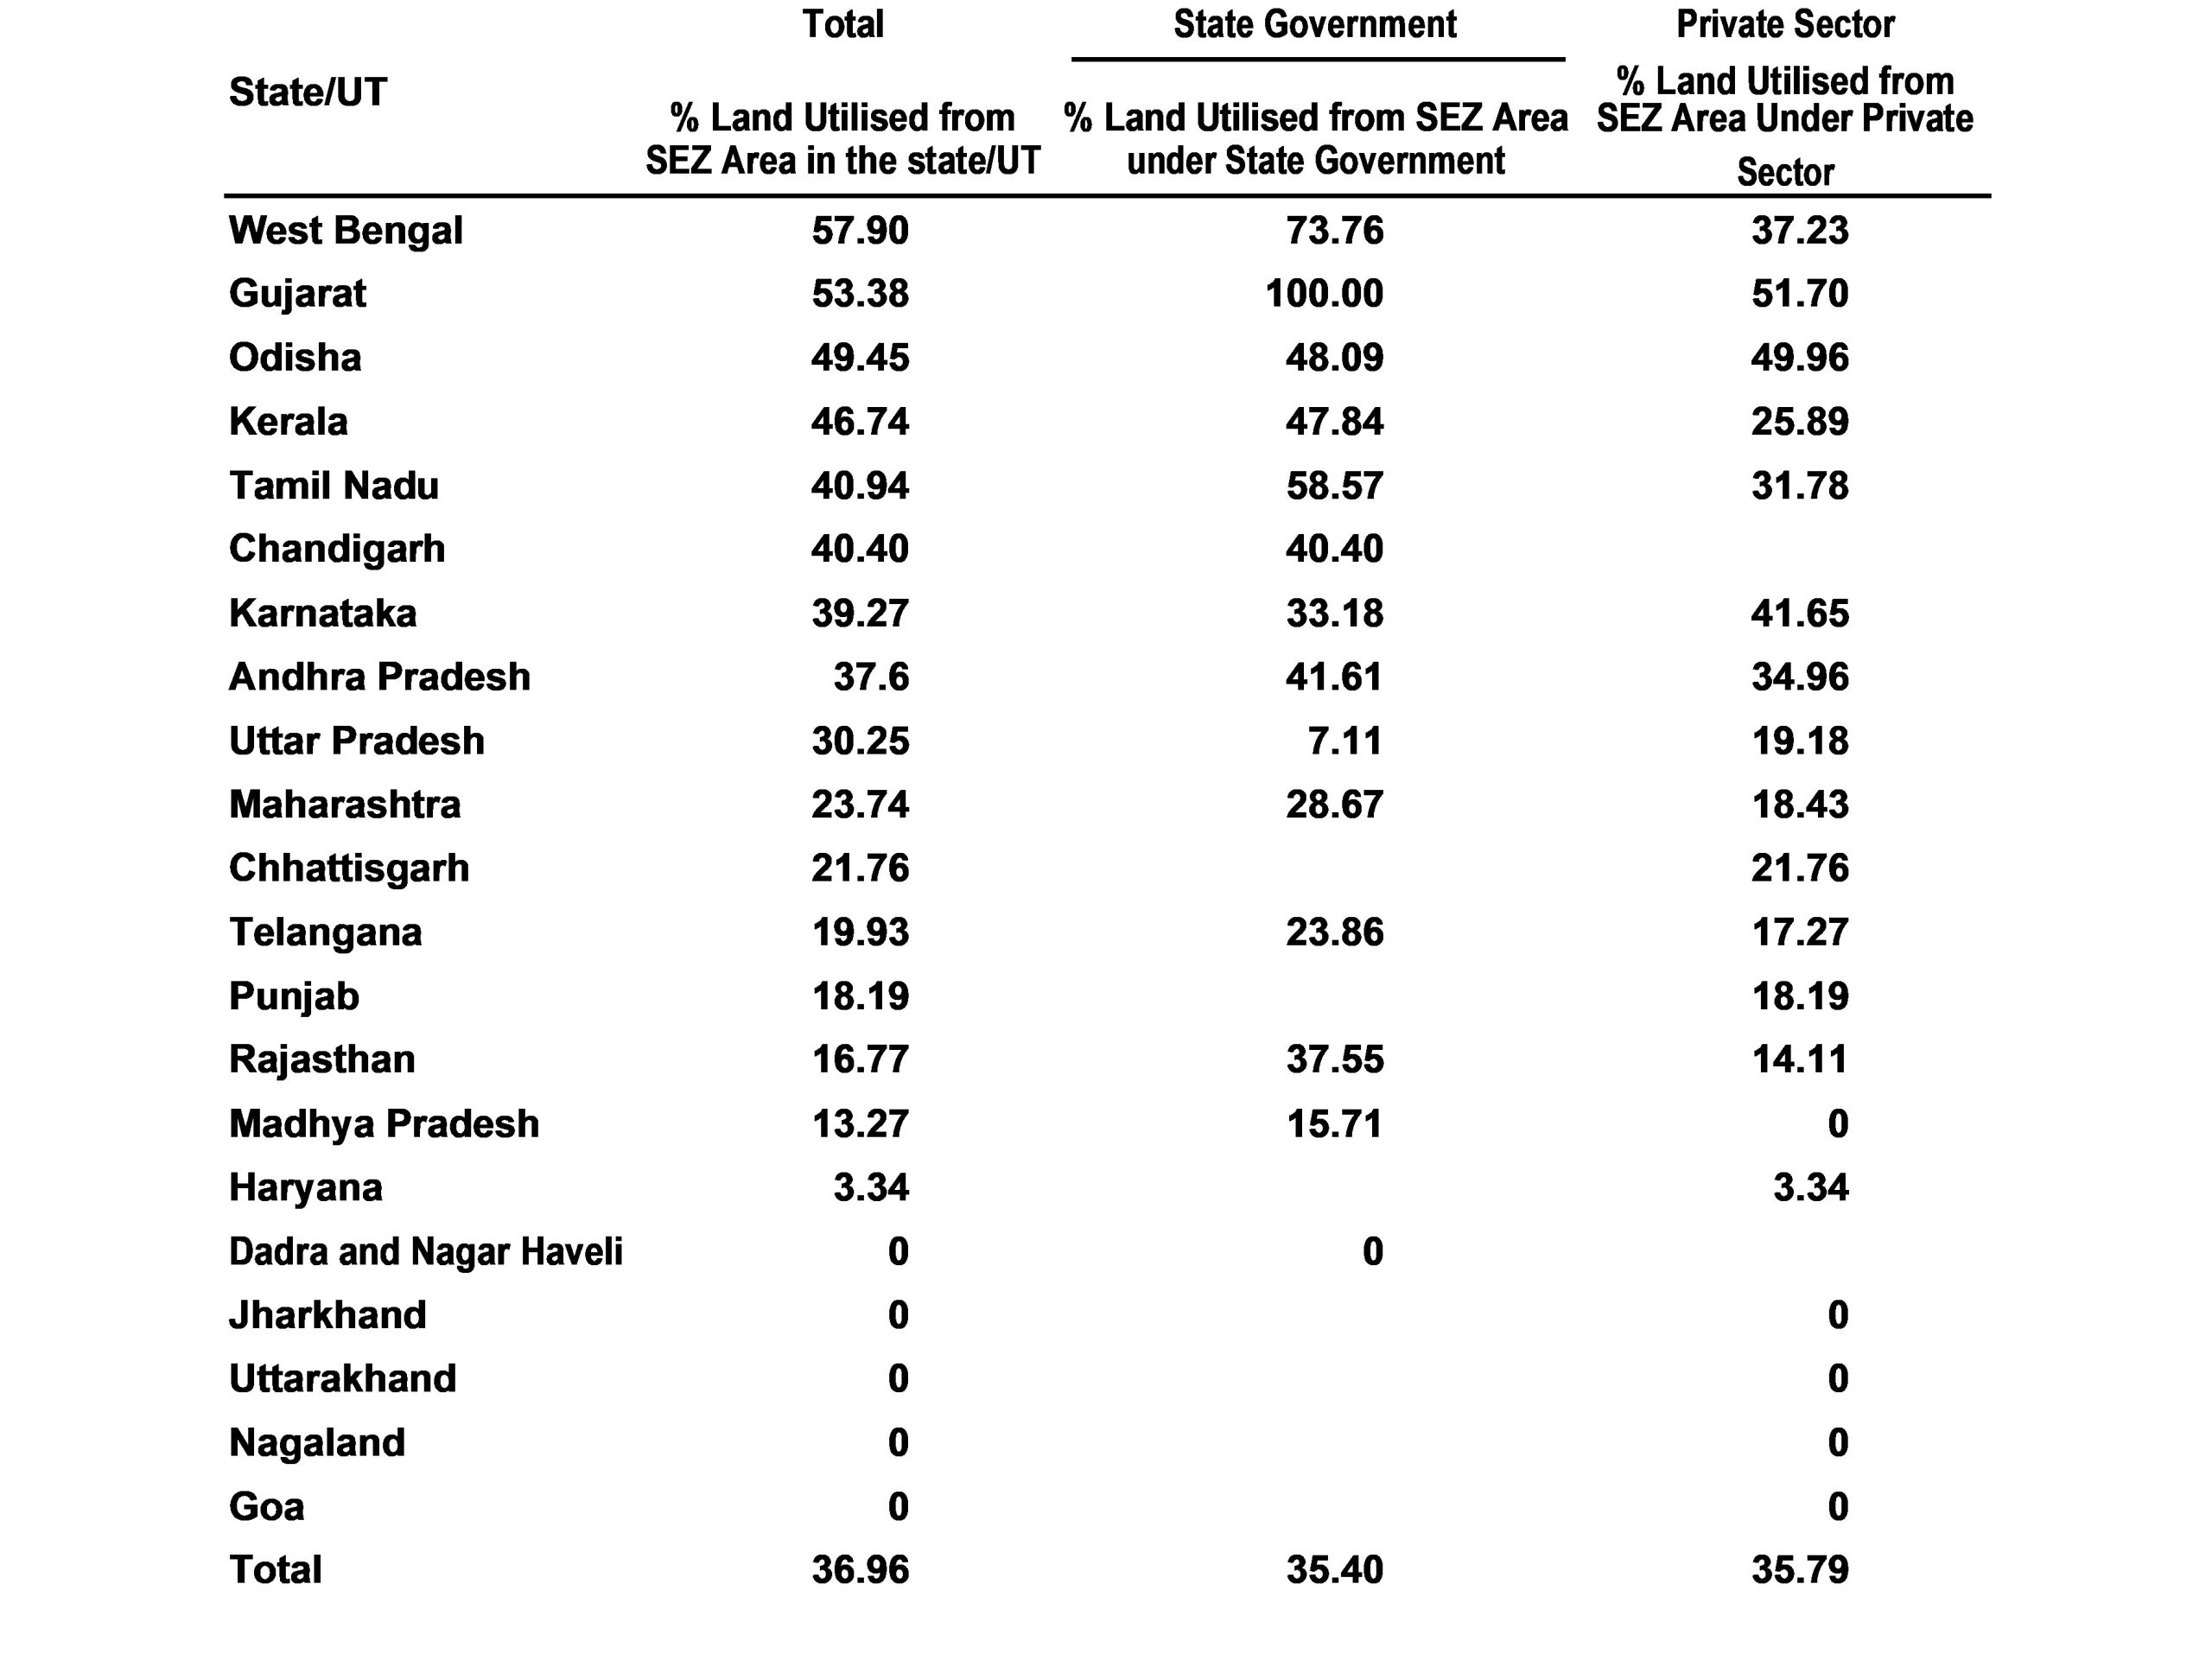
Note: The percentage of area utilised under each category (total, state, and private) is calculated from the total area under that category in the state/UT. The blanks denote non-existence of SEZ with the state/private sector in that state or UT.
Source: Computed from GOI, 2014.
Land utilisation is slightly above 50 per cent only in the state of West Bengal and Gujarat. At the promoter level, in the privately developed SEZ, Gujarat tops in land utilisation at 51.7 per cent. Interestingly, in Madhya Pradesh, Jharkhand, Uttarakhand, Nagaland, and Goa, no land has been utilised in the privately developed SEZs. Since the per cent land utilised also covers the area under amenities, no utilisation means that the private sector in these states has not yet started work to develop the SEZs. In case of state government developed SEZs such situation exists in the UT of Dadar and Nagar Haveli. In state promoted SEZs, utilisation of land is 100 per cent in case of Gujarat and 73.76 per cent in West Bengal.
Extent of Vacant Land in Processing Area
Low utilisation of land in SEZs is also brought out by the extent of vacant land in the processing area (Table 2).
Table 2: Per cent Vacant Land in Processing Area to Notified Area (as on January 23, 2014)
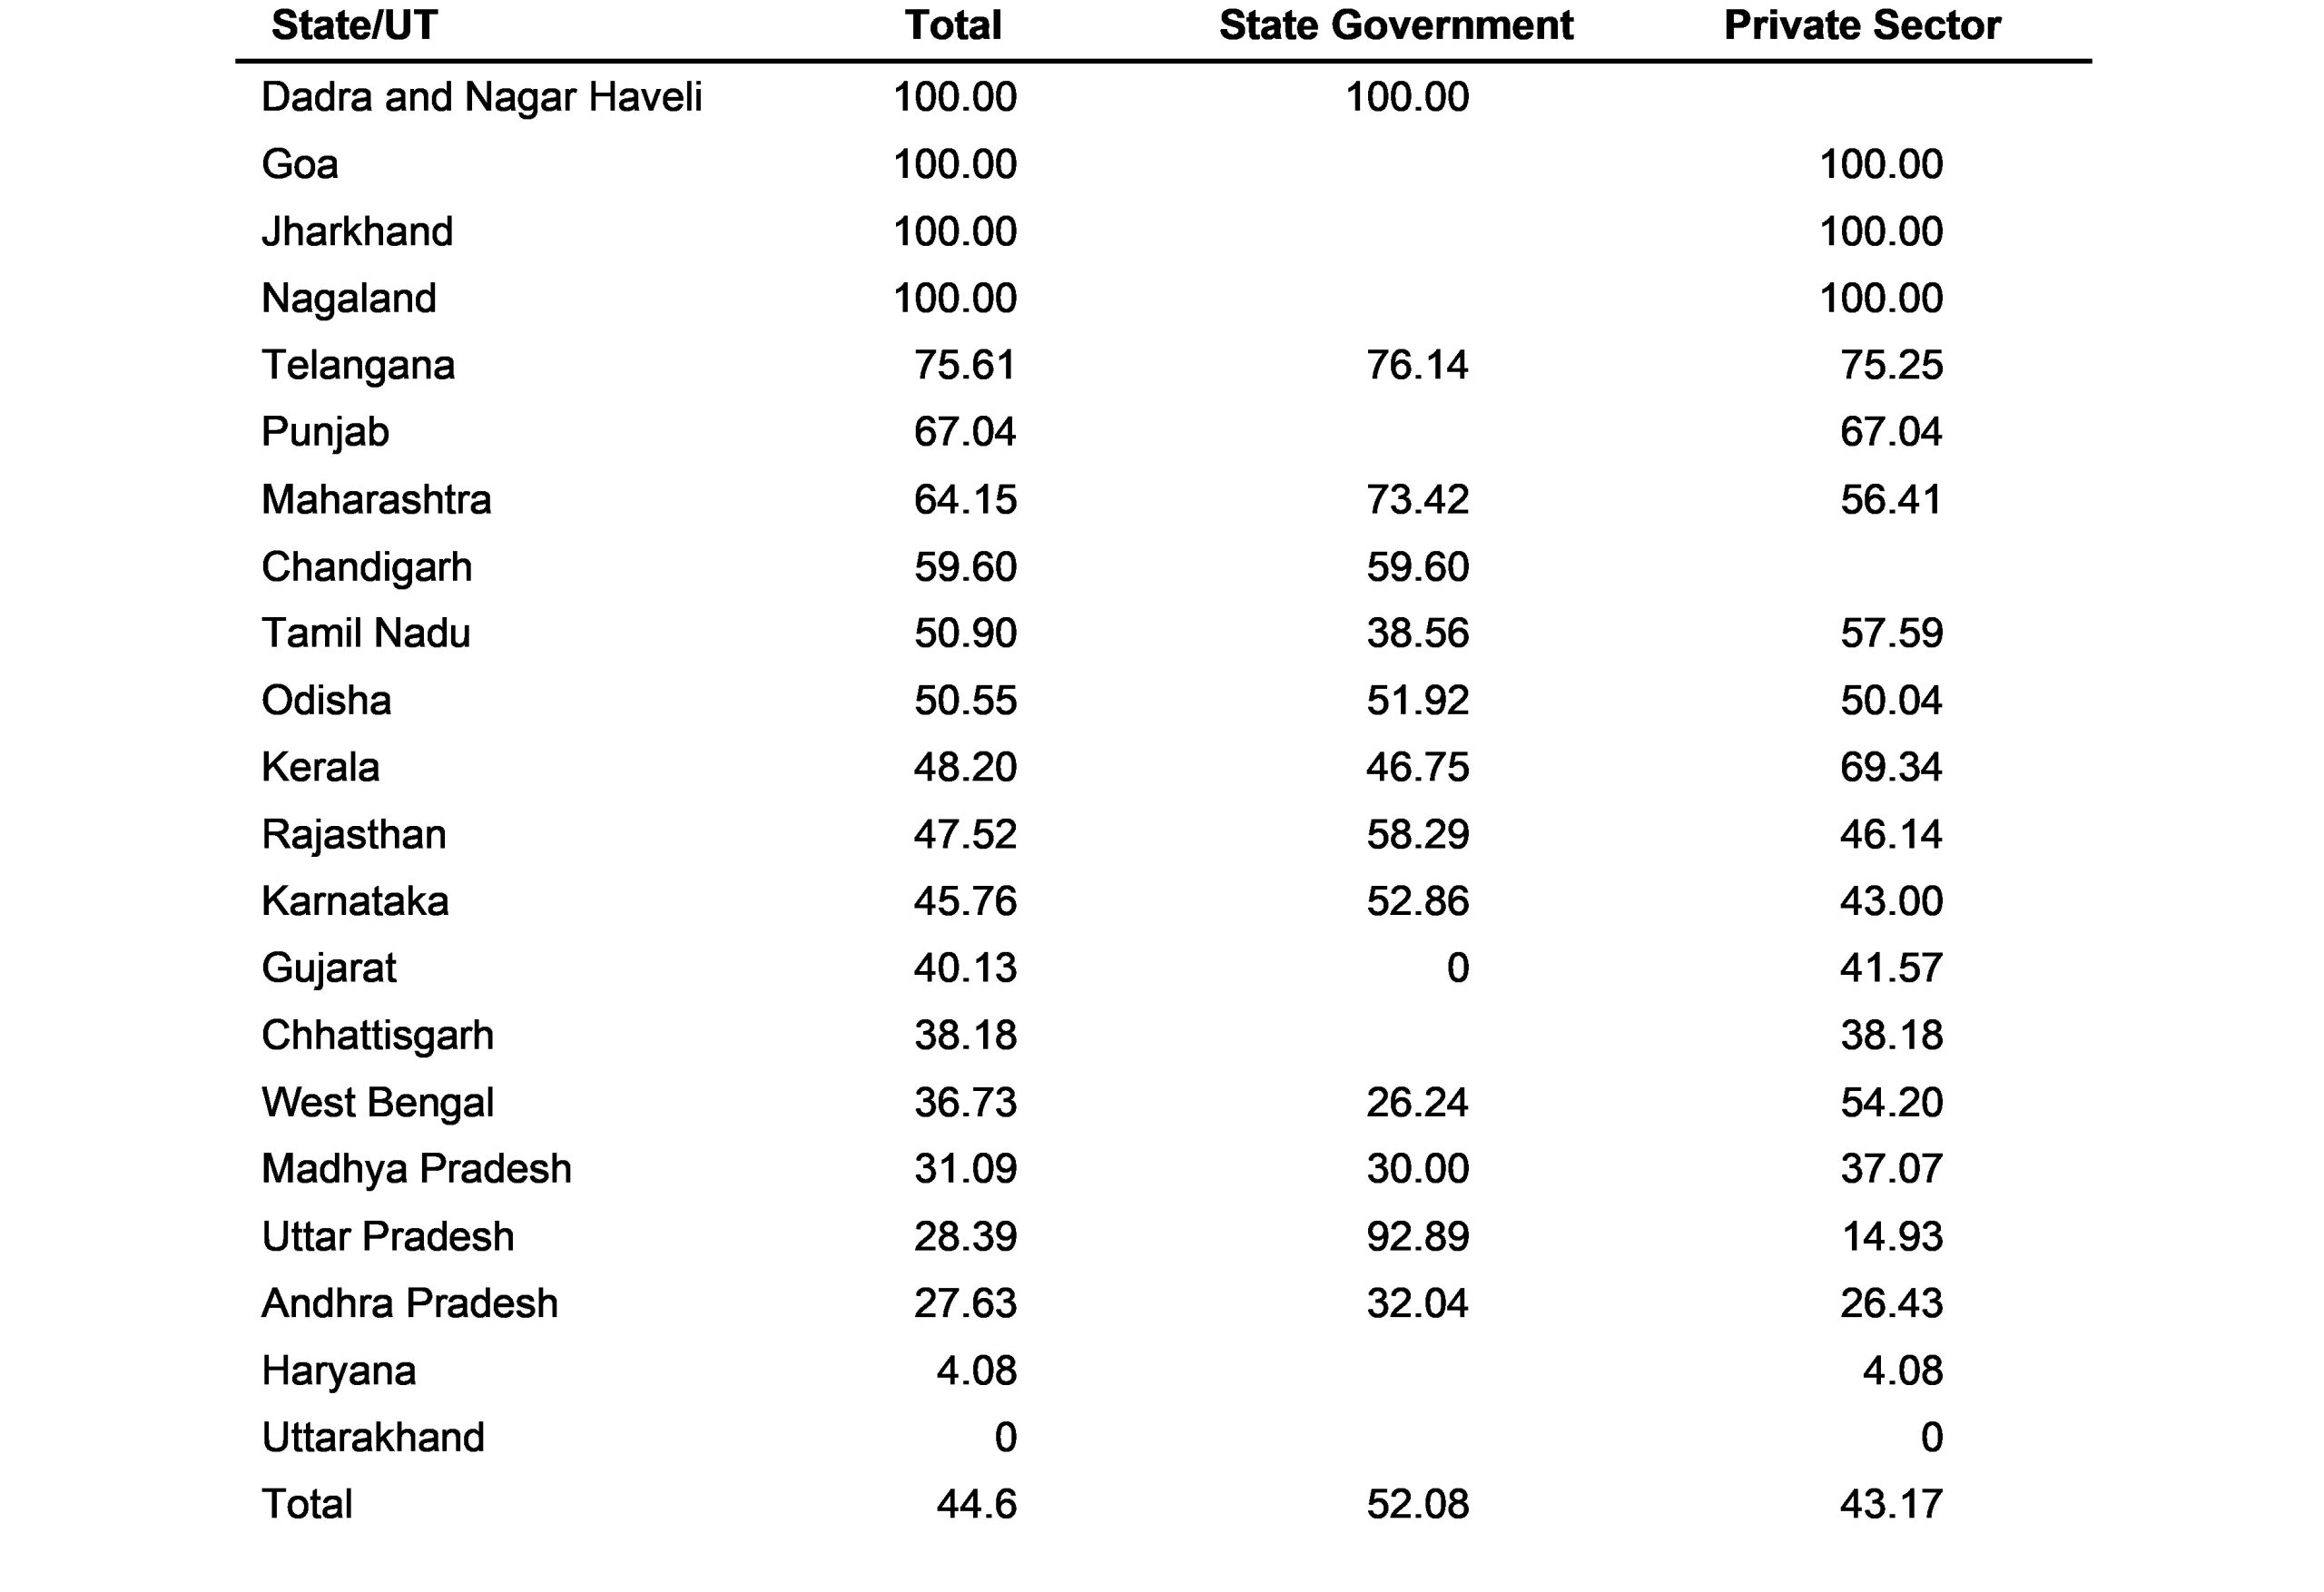
Note: The percentage of area vacant under each category (total, state, and private) is calculated from the total area under that category in the state/UT. The blanks denote non-existence of SEZ with the state/private sector in that state or UT.
Source: Computed from GOI, 2014.
From Table 2 one can notice that vacant land in processing is almost half the area (45 per cent of the total notified area) under SEZs in the country. Moreover, in Dadra and Nagar Haveli, Goa, Jharkhand, and Nagaland, the entire notified area meant for processing is vacant. Among other states, the share of vacant land is notable in Telangana, Maharashtra, and Tamil Nadu. These are states with large areas and the higher number of SEZs in the country.
In privately developed SEZs, vacant land is the largest in Telangana (75.25 per cent). Vacant land amounts to over 50 per cent of the notified land in the states of Kerala (69.34 per cent), Punjab (67.04 per cent), Tamil Nadu (57.59 per cent), Maharashtra (56.41 per cent), and West Bengal (54.20 per cent). In state government promoted SEZs, vacant land in processing area varies from 50 per cent to 93 per cent, with the highest in Uttar Pradesh, followed by Telangana, Maharashtra, Rajasthan, Karnataka, and Odisha.
There are, for example, sectors like IT/ITES, biotechnology, gems and jewellery and handicrafts, which are less land-intensive than say engineering, textiles, or chemicals. However, there is no difference in the extent of vacant lands.
The regression analysis reveals operational status as the only factor significantly impacting land utilization (Table 3).
Table 3: Regression Model of Land Utilisation in an SEZ
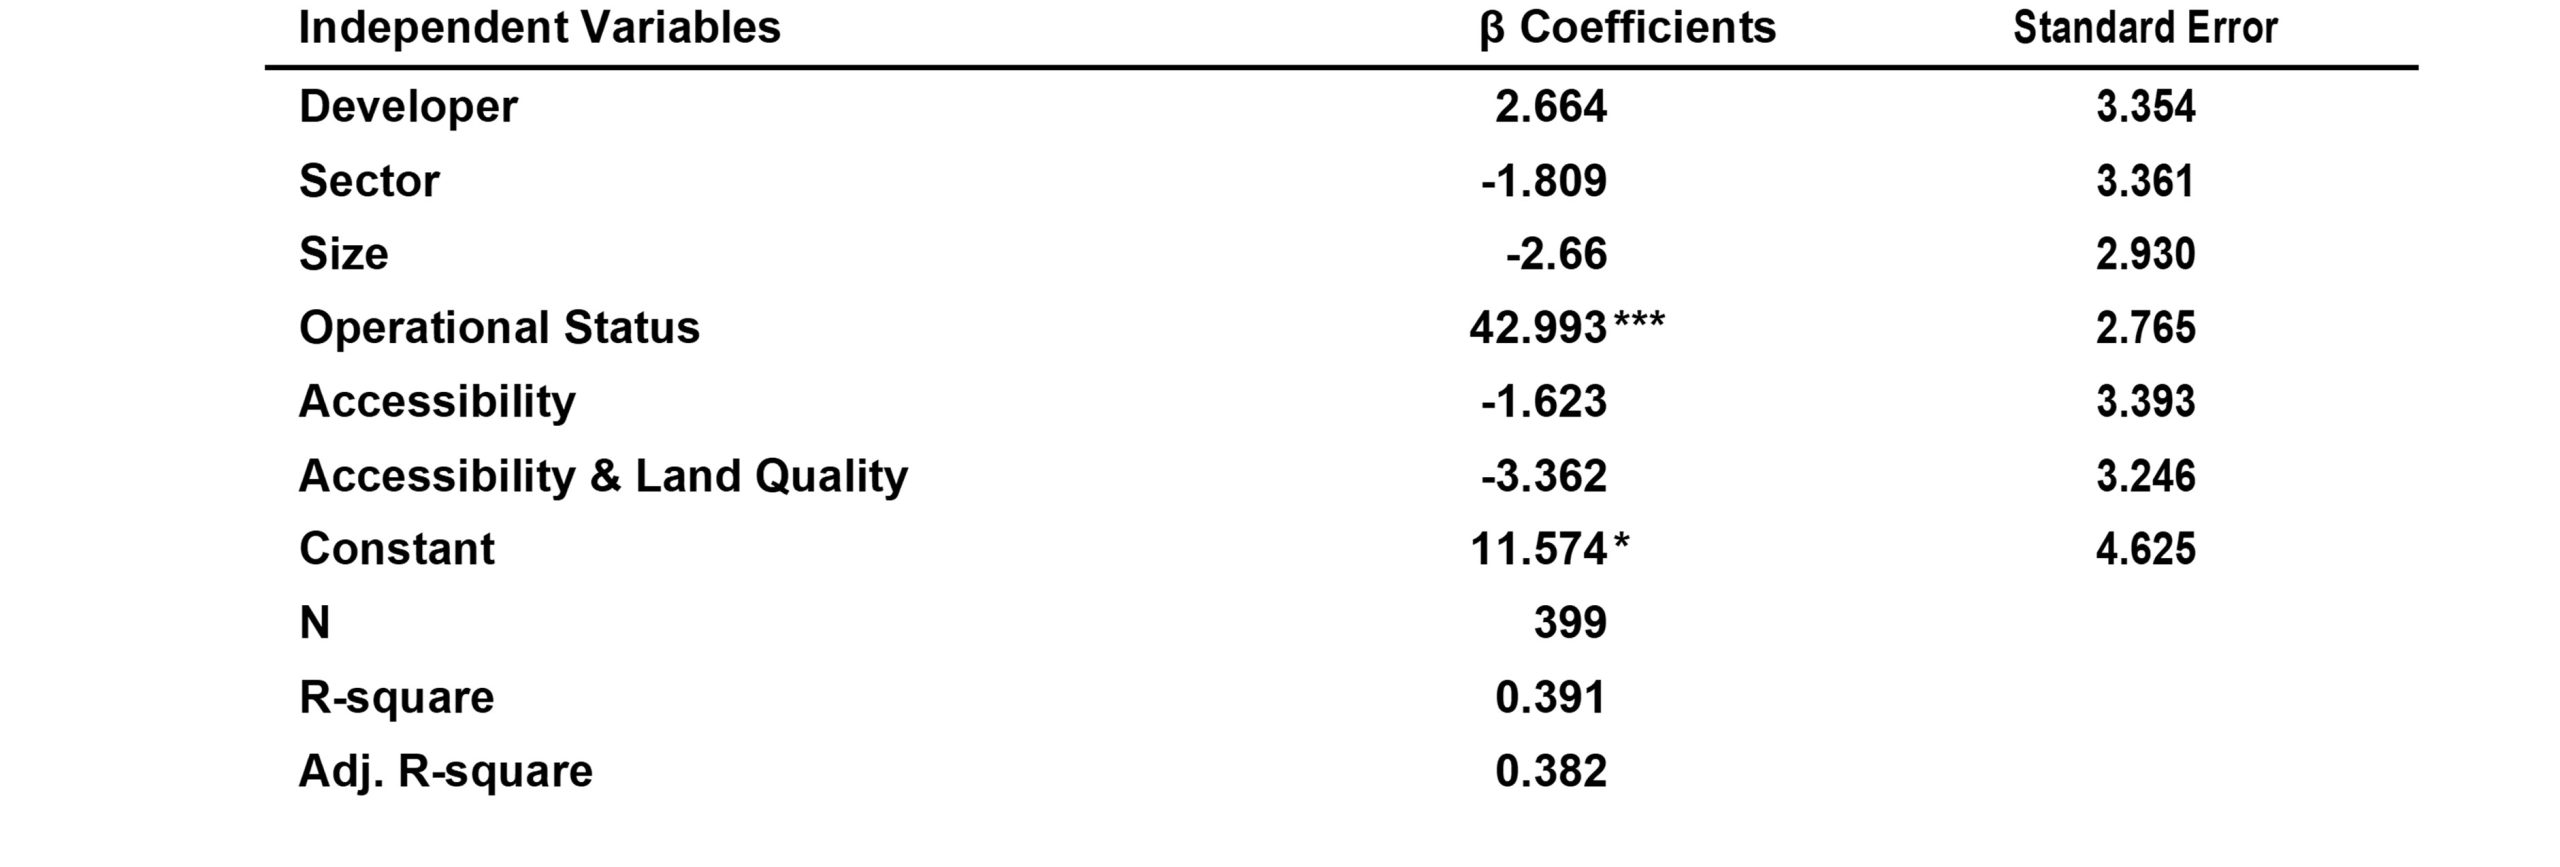
This raises an important issue of why then SEZs remain non-operational beyond specified years. One related aspect with the gap in operation is the number of additions and de-notifications.
IV Additions and De-notification of SEZs
By analysing the SEZ data of 2014 and 2017 (Table 4), we found additions of 49 SEZs and probable de-notification of 78 SEZs in the country between 2014 and 2017 (those SEZs of 2014 which do not appear in the list of 2017).
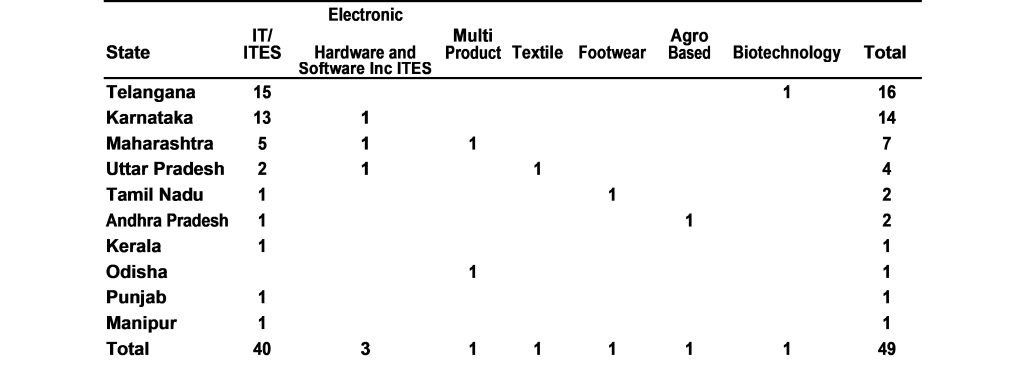
Out of the 49 SEZs added, 37 have been added in just three states – Telangana Karnataka (14), and Maharashtra (7). Moreover, majority of these SEZs are essentially in the IT/ITES sector (Table 5).
Table 4: Change in the Number of SEZs between January 2014 and December 2017
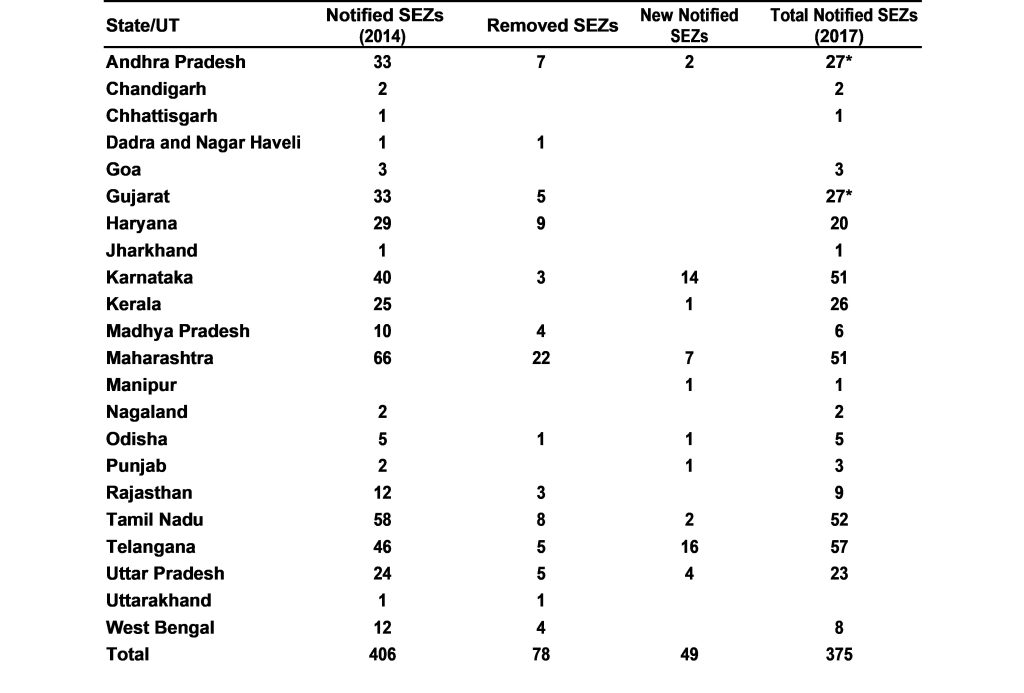
Note: In Andhra Pradesh, Kakinada SEZ 1 and 2 were merged in 2016, which brought the number to 27 rather than 28. Similarly, in Gujarat, Adani, and Mundra Ports were merged in 2016, thus bringing the number down to 27 rather than 28.
Source: Computed from GOI, 2014 and GOI, 2017a.
Table 5: New Notified SEZs (Between January 2014 and December 2017)
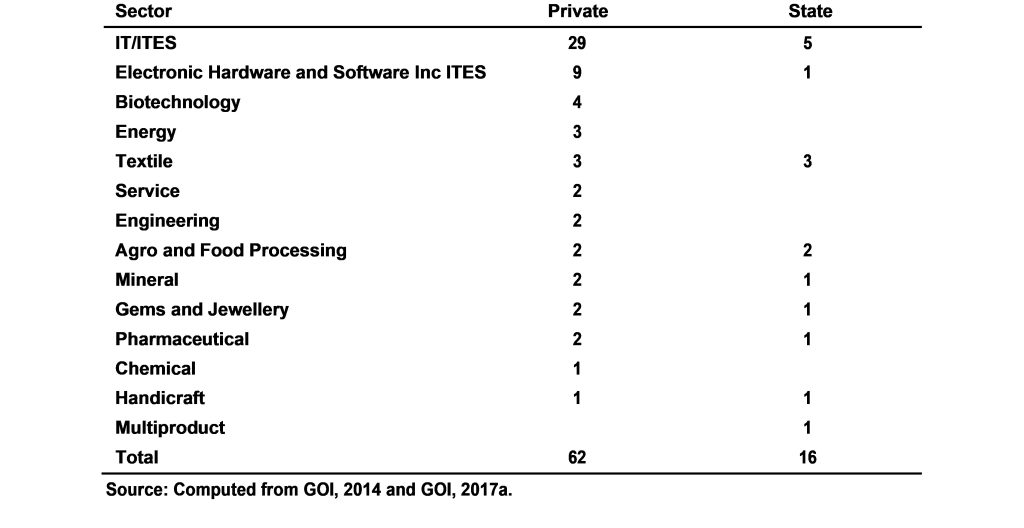
Highest number of SEZs were de-notified in Maharashtra (Table 4). Some 22 SEZs have probably been de-notified in the state. Haryana has also probably de-notified nine SEZs. Clearly, these are cases of total de-notification, partial de-notification may also have taken place after the revision of the area in August 2013. The de-notification is basically of private SEZs and mainly of the one in IT/ITES sector (Table 6).
Table 6: SEZs Removed Between January 2014 and December 2017
V Time Lag between Notification and Operation
From the list of existing SEZs (as on December 01, 2017) it is found that many of them were notified in the years immediately following the implementation of the SEZ Act. Figure 3 presents SEZs as existing in December 2017 by their year of notification. In addition, if these SEZs have been operationalised by December 2017, they have been marked in the figure 3 corresponding to their year of notification.
The peak in notification is observed in 2007 with most of them being notified between 2006 and 2009. The slightly upward trend is noticed from 2015 onwards, but this is not uniform across all states. In 2016, 11 SEZs were notified with 9 in the states of Karnataka and Telangana. In 2017, these two states accounted for 22 of the 31 notified SEZs.
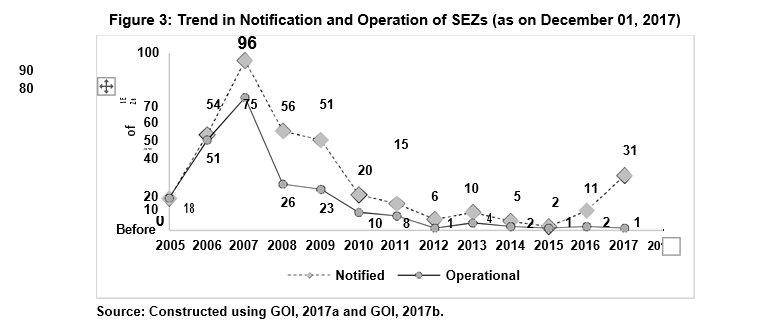
As per the Rules, the SEZ must begin operations within three years of receiving formal approval (GOI 2010). To be precise, at least one unit should start functioning within three years of receiving the formal LOA. By giving leverage of three years, one may ignore the proportion of operational SEZs in 2015 and later years; however, the proportion of operational SEZs notified earlier than 2015 is low. It can be clearly seen from Figure 3 that the operational percentage of SEZs notified as early as 2008/2009 is below 50 per cent. SEZs that were notified in 2006/2007 have best operational level. Of 54 SEZs that were notified in 2006, 51 are operational. Of 2007, it is 96 notified, of which 75 are operational. In all other years, the operational level is low, falling to 17 per cent of those notified in the year 2012 (notified – 6; operational – 1).
VI Locational Aspects of SEZs
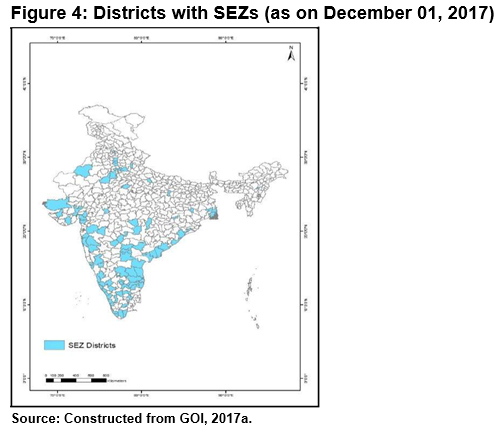
Figure 4 displays the location of SEZs in the country in terms of districts. From the figure, one can see that the SEZ spread is more in the peninsular part of the country, with concentration in coastal districts. High external connectivity, ample availability of water resources, and dense population could be the reasons for such location of SEZs. In the northern part of the country, majority of the development has basically happened in districts neighbouring Delhi. In terms of number (based on Figure 4), SEZs are spread across 94 districts in the country.
Considering the attributes of districts in terms of accessibility and land quality (see Section II for criteria), the districts with SEZs are divided into two groups: preferred and unsuitable. A district with SEZs is said to be preferred if it is accessible (on the criteria of accessibility), and if accessible in land characterised by unproductive and scrub land (on the criteria of accessibility and land quality). A district is unsuitable for locating SEZ if it is inaccessible or having agriculturally productive land.
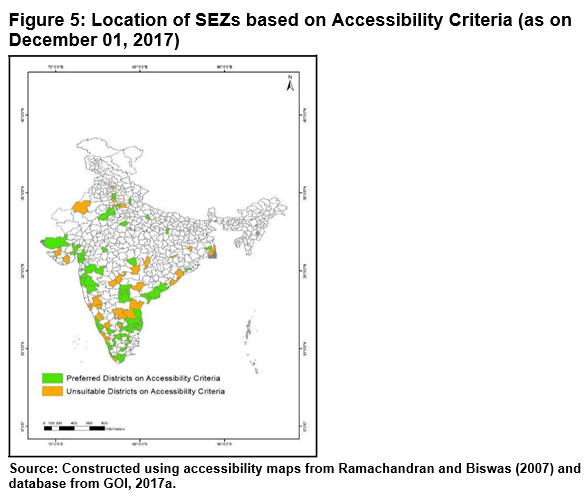
From Figure 5 it can be seen that most of the districts with SEZs are the ones with accessibility advantage. Based on this criterion, the SEZs are spread across 58 preferred districts (Figure 5).
In terms of location in districts characterized by accessible unproductive and scrub land, the SEZs are located only in 26 preferred districts (Figure 6). Remaining 68 districts of locations of SEZs are unsuitable districts. It means 68 districts of location of SEZs are characterised by agriculturally productive land.
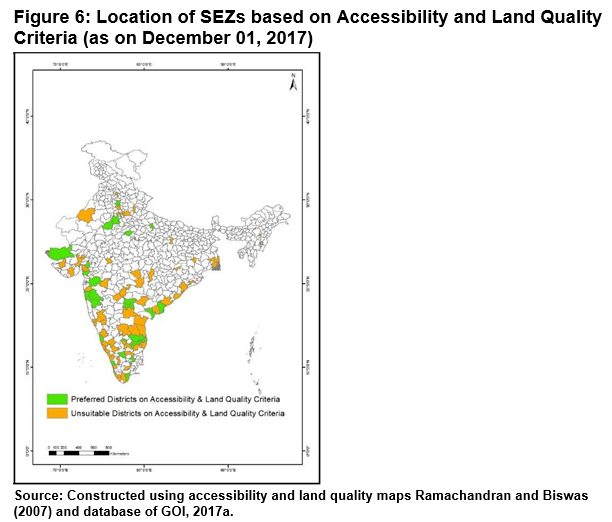
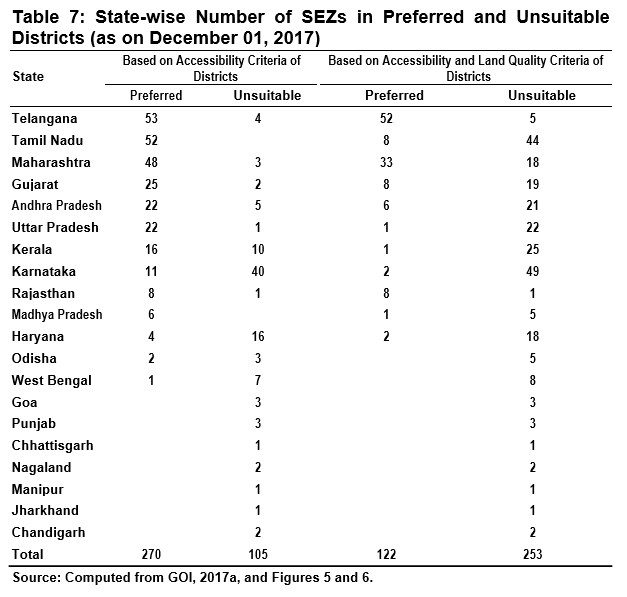
In terms of number of SEZs, accessibly preferred districts account for 270 SEZs (Table 7). With accessibility and unproductive and scrub land together, number of SEZs in preferred districts reduced to 122. The remaining 253 SEZs are located in districts with agriculturally productive land.
In terms of accessibility factor, SEZs are mostly located in preferred districts. In Tamil Nadu, all SEZs are located in accessible districts. But when it comes to accessible districts with unproductive and scrub land, the SEZs are mostly located in unsuitable districts – a feature found in all states with the exception of Telangana, Maharashtra and Rajasthan. In case of Telangana out of 53 SEZs located in accessible districts, 52 are located in districts characterized by unproductive and scrub land. In Maharashtra, out of 48 SEZs, 33 are accessible in unproductive land type district. The SEZs located in productive land in Maharashtra are 18. Rajasthan has 9 SEZs out of which 8 are preferably located with respect to accessibility. These 8 are also preferable with respect to land quality needed in terms of unproductive and scrub land type.
We may thus conclude that SEZs not only enjoy accessible locations, but they are also located in productive lands. The developer does not appear to be suffering from any constraint as far as location is concerned.
VII Summing Up
The paper analyses the level of land utilisation in SEZs. The analysis is carried out at the state level considering the factors of promoter, sector, accessibility and land quality. From the analysis, one finds utilisation of land to the extent of just 37 percent of notified lands. Within processing area, vacant land constitutes nearly half of the area under SEZs in the country. Vacant land is significant in states like Telangana, Maharashtra, and Tamil Nadu, notable with respect to quantum of SEZ area and number of SEZs in the country. Operational percentage of exiting SEZs, notified as early as 2008/2009, is below 50 per cent. Between the year 2014 and 2017, 49 new SEZs have been notified while 78 SEZs have probably been de-notified largely in Maharashtra and Haryana. The de-notifications are mainly of private SEZs and that, too, of those in IT/ITES sector. Most of the SEZs have locational advantage. From 94 districts with SEZs, 58 meet the accessibility criteria in terms of broad-gauge railways, highways, and level of urbanisation.
There is thus a clear case of substantial unutilised land with SEZs. This has repercussion not just on the use (misuse) of land but also on the policy of SEZs as an instrument of industrialisation and concomitant employment growth. The change in tax incentives in 2011/2012 (DDT, MAT) may have made SEZs non-functional. But the point is about why others are functional despite such change and also why new SEZs have come up after 2012. This needs in-depth analysis of the tax regime using primary survey. The change in export demand may also have bearing on utilization of land. But the question is, are these factors not taken into account while preparing the proposals for setting up of an SEZ? Every proposal for setting up of SEZs includes prospective investment in SEZ, and also the land going to be utilized separately in processing as well as non-processing. There appears to be a problem at the level of the policy itself. There is absence of realistic scrutiny of the proposals.
Sizes are also arbitrarily defined. Had the sizes been scientifically determined, the reduction in specification of area would not have taken place. From 2006 to 2013, there was a 50 per cent reduction in area requirement of many of the sectors (GOI 2013). In another notification dated September 19, 2018, area requirement of 10 ha for biotechnology and health sector (excluding hospitals) was withdrawn (GOI, 2018a). The notification of December 17, 2019, made significant change in the land area requirement (GOI 2019). According to this notification, all existing notified SEZs would deem to be multisector SEZs with minimum land area requirement of 50 ha/25ha/no minimum. The change in the principle requirement of land size over time shows lack of any principle in deciding the sizes. The reduction in land size requirement for SEZs may lead to de-notification of the excess land held by different SEZ developers. But the question is whether or not the de-notified (excess land) land would be used for industrial purpose.
Unutilised land with SEZs appears to be a result of the transfer of large areas of land from the government (in all those cases where government transfer or acquire land on the behalf of the private promoters).
Though no speculative use is expected in case of government SEZ, the large extent of vacant land can be taken as an indicator of inefficiency. In private SEZs, other than the indication of inefficiency, the vacant land also exhibits future use and land hoarding. Since the majority of the SEZs are located in proximity to million cities, the speculation cannot be missed. The proximity to urban areas and speculative use are well documented in the literature. The urban areas have tendencies to sprawl which make their fringes the preferred site for investment to gain from speculation.
From the analysis accessibility appears to be only criteria that has been applied since the promoters of SEZ are only concerned with this and ignore ‘land quality’ considerations, which capture social and environmental dimensions. The fact that the original Act only hopes that agriculturally fertile land is not encroached upon without framing any rules relating to it. There is a need to amend the Act by excluding areas under forests, alluvial soil (dimensions of land quality) from being considered for SEZ.
With respect to what need to be done to resolve the issue of already existing unutilized land with SEZs, the following possibilities other than reducing size emerge: First and foremost is developing new units in existing SEZs. Only when existing zones are saturated should new SEZs come up. In fact, the power delegated to Development Commissioners with respect to units from one SEZ to another within their jurisdiction should be used to saturate SEZs one by one (see Lok Sabha, March 4, 2020). With declaration of all SEZs as multi sectoral, such process would be easy (GOI 2019). Focus may be laid on first-time entrepreneurs or first-time exporters. The developer should be entrusted with functions like finding markets for units, helping units to establish linkages with clients, to innovate, and so on. In other words, handholding needs to be ensured. Central government also, by involving developers, could undertake all India export demand mapping for each and every product/service. The government could further enrich the database by adding information of export units outside SEZs.
An option could also be to throw open the SEZs to meet domestic demands as well. The Expert Group appointed by the government also recommended the same (GOI 2018b). This will not only stimulate economic growth and employment, but also leverage investments. As per current mechanism, sale is allowed in domestic area on payment of custom duties. Unless one has a niche market for the product, such a sale can become unprofitable. The government in Budget 2022 declared introduction of new SEZ law by end year 2022. The new legislation is expected to allow domestic sale by charging some equalisation levy so as not to disadvantage domestic units (Business Standard, February 02, 2022). In fact the character of the SEZs as export enhancing areas should not be altered. SEZs should be promoted for export purposes and for this to happen effectively, the incentives and conditions in SEZs should be linked to quantum of exports, investment achieved, and location of SEZs in unproductive lands. This would remove unnecessary duplication with other zonal schemes like Industrial Clusters, Investment and Manufacturing Zones.