Financial Conditions of Elderly People in Different Regionsof India
December 2023 | Antara Dhar
I Introduction
Declining fertility and mortality has changed the age structure of the population in the world.
Ageing of population, i.e., the proportion of aged in the total population increases owing to the reduction of fertility and mortality. During the 1950s, the world population aged 60 years and above was 205 million (8.2 per cent of the population) which increased to 606 million (10 per cent of the population) in 2000 (Raju 2011). Population projection indicates that the elderly population in the world will grow from 542 million (9.5 per cent of world population) in 1995 to 1.9 billion (20.7 per cent of world population) in 2050 and further to 3.3 billion (30.5 per cent of world population) in 2150 (Rajan, et. al. 2008). United Nations (2009) predicts that 60+ populations will grow from an estimated 737 million older persons in 2009 to 2 billion by 2050, at which time the elderly population will outnumber children aged 0-14 years (United Nations 2009). Developing countries are experiencing the ageing of population in recent years unlike developed countries. According to United Nations (2005), in the more developed regions, elderly population is expected to increase from 20.2 per cent in 2005 to 27.5 per cent in 2025 and to 32.4 per cent in 2050. In less developed regions, proportion of aged people will increase from 8.2 per cent to 12.8 and again to 20 per cent during the same time period. In the least developed regions, the proportion of aged will be only 9.9 per cent by 2050 (United Nations 2005). In 1990, the 60 years and above population in the developing countries exceeded that of the developed countries (Rajan, et. al. 2008) and in 2009, two-third of the world’s elderly people lived in developing countries (Subaiya and Bansod 2011). The projection shows that between 2006 and 2030, the increasing numbers of older people in less developed countries are expected to increase by 140 per cent as compared to an increase of 51 per cent in the more developed countries (Krug 2002). In 2050, 82 per cent of the world’s elderly will be living in the developing regions of Asia, Africa, Latin America and the Caribbean, while only 16 per cent of them will reside in the developed regions of Europe and North America (Raju 2011). UN projections indicate that most of the 80+ people are currently living in developed regions, but soon majority will be living in the less developed regions. So, by 2050, more than 70 per cent of the above 80 populations is expected to be living in the less developed regions. Another important fact is that although the proportion of people living beyond the age of 100 is very small, this number is also growing rapidly (United Nations 2002).
Ageing of population imposes many challenges to the society, related to social security, health service, crisis in caring for the elderly, etc. Most of the developing countries do not have social security for the aged. Now-a-days, the 60+ populations, not only in developing countries but also in developed countries, are participating in the labour market and rely on their own income. In a country like India, where 60+ population is increasing1 very rapidly from 2001 onwards with respect to total population, the ageing of population is a big concern for the policy maker. Some social security benefits are available for the elderly in India such as – Integrated Programme for Older Persons(IPOP), National Programme for the Health Care for the Elderly (NPHCE), National Old Age Pension Scheme, etc. Many authors have claimed that the coverage of this social security is inadequate. In the absence of such benefit, many elderly people in India are participating in the labour market. In this paper, I want to analyse the earnings of the 60+ populations in India in recent years. Here, I have disaggregated the whole analysis into six different geographical zones.
II Literature Review
There are different sources of income of the elderly people such as income from government as social security benefit, income from labour market participation, income from relatives, etc. In some countries social security is the main source of income for the 60+ populations such as in Japan (Murozumi and Shikata 2008). However, in UK, Denmark, USA and also in Japan we can see other sources too, such as social insurance benefit, private occupational income, market income, etc. Going through the literature, it has been noticed that the earnings of the elderly originated from current economic activities differ among the pensioners and non-pensioners, e.g., in Bangladesh 8 to 12 per cent of the total income of the pensioners comes from economic activities where as for the non- pensioners, the figure is about 58 per cent of their income (Mahmood, et. al. 2008). If the retirement benefits are not sufficient, elderly people depend on other sources of income, such as in Sri Lanka (Rerera, et. al. 2008). However, in the countries where early retirement benefits are lucrative, elderly people are not interested to re-join the labour market after their retirement (Auer and Fortuny 2000). In many countries we can observe inverse ‘U’ shape relation between wage and age of the elderly (Leslie, et. al. 2009, Gelderblom 2005). In Japan after retirement elderly people join labour market at a lower wage (Auer and Fortuny 2000). According to Becker (1964) the rate of earnings increase with age might be positively related to the level of skill.
In the context of the financial conditions of 60+ populations in India, we can see a few studies have focused on earnings of elderly people. Selvaraj, et. al. (2011) illustrate trends in real daily earnings of elderly workers using National Sample Survey Office (NSSO) data. They have pointed out that nominal wages and real wages of regular and casual elderly workers have increased from 1983 to 2005. According to Selvaraj, et. al. (2011) although elderly workers receive lower wages, compared to the non-elderly (15 to 59 years) in 2004-2005, they contribute significantly to household income (about four to five per cent on average to the total household income). UNFPA (2012) study has also analysed the earnings of the elderly but this study is based only on seven states in India and mentioned that overall 74 per cent elderly men and 41 per cent elderly women receive some personal income. Among the elderly, 43 per cent receive no income, 22 per cent elderly receive less than ₹12000, 21 per cent are getting between ₹12000 and ₹50000 and around 14 per cent receive more than ₹50,000 per annum (UNFPA 2012). The same study revealed that mean income is lowest in Tamil Nadu and highest in Himachal Pradesh.
The study of Selvaraj, et. al. (2011) and UNFPA (2012) although focused on the earnings of elderly has some limitations that we can observe, such as Selvaraj, et. al. (2011) did not consider the earnings of the elderly across level of education and expenditure classes; UNFPA (2012) study is based only on seven states in India. However, analysis of earnings of the 60 + populations across
different geographical zones helps us to analyse and compare the financial conditions of the elderly people in different regions of India.
In this paper, I want to examine the financial conditions of the elderly people in India in terms of daily average real earnings in different regions in recent years. Also, here I would like to focus on the discrimination of the elderly in the labour market in recent years in different zones.
Data Base and Methodology
Data Base
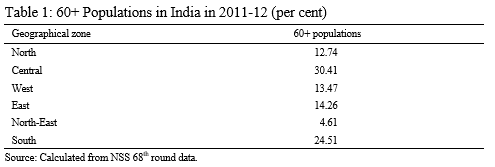
In this paper, National Sample Survey (NSS) Organization’s unit level data on Employment and unemployment in India has been used, in particular this study uses NSS 68th round (2011-2012) data on Employment and unemployment situation in India. In the 68th round2, data was collected for 4,56,976 individuals, among which there were 38,027 individuals aged 60 years and above. For the purpose of analysis some variables had been constructed from the unit level data of NSS such as geographical zone, education level, socio-religious identity, monthly per capita expenditure, etc. In order to examine earnings of elderly, I have considered six geographical zones —North (Haryana, Himachal Pradesh, Jammu and Kashmir, Punjab, Chandigarh, Delhi, etc.), Central (Bihar, Madhya Pradesh, Rajasthan, Uttar Pradesh, etc.), West (Goa, Gujarat, Maharashtra, Dadra and Nagar Haveli, Daman and Diu, etc.), East (Orissa, West Bengal, Assam, Tripura, etc.), North-East (Arunachal Pradesh, Manipur, Meghalaya, Mizoram, Nagaland, Sikkim, etc.) and South (Andhra Pradesh, Karnataka, Kerala, Tamil Nadu, Andaman and Nicobar, Lakshadweep, Pondicherry etc.). Educational level of the elderly has been categorised as illiterate, below primary educated, primary educated, middle educated, secondary educated, higher secondary (HS) educated and above HS educated. Below primary education level also includes informal education. Socio-religious identity of the people is categorised as — Muslim, Hindu Upper Caste (HUC), Hindu Schedule Caste (HSC), Hindu Schedule Tribes (HST), Hindu Other Backward caste (HOBC), and other caste (Others) etc. NSS data (Schedule 10, section 9) also provides information of total monthly consumer expenditure. In this paper, I have considered quintile division of monthly per capita expenditure for the purpose of analysis. Table 1 depicts percentage of the elderly populations in India in 2011-2012 across six different geographical zones. The highest percentage of elderly people has been found in Central India followed by South India in the 68th round of NSS. However, lowest proportion of elderly has been observed in the North-East India.
Econometric Analysis
Some of the important determinants of earnings of elderly people in different regions of India has been considered here, such as age, education level, socio- religious identity, occupational category, state level unemployment etc. In order to examine the effects of explanatory variables on the earnings of 60+ workers, I have considered the following model:
LE = α + β1 AGE + β2 ILLITERATE +β3 BPRIMARY + β4 MIDDLE +β5 SECONDARY + β6 HS + β7 ABOVE HS + β8 MUSLIM + β9 HSC + β10 HST + β11 HOBC + β12 HOTHERS + β13 SJOBS+ β14 CLERK+ β15 CRAFT + β16 UNEMP
where
LE = Log of daily earnings of the respondent
AGE = Age of the respondent (here for the purpose of analysis age of the respondent has been subcategorised as – 60-65 years, 66-75 years and above 75 years)
ILLITERATE = 1 if the respondent is illiterate; = 0 otherwise
BPRIMARY = 1 if the respondent has below primary level of education; = 0 otherwise
MIDDLE = 1 if the respondent has middle level of education; = 0 otherwise SECONDARY = 1 if the respondent has secondary level of education; = 0 otherwise
HS = 1 if the respondent has higher secondary level of education; = 0 otherwise ABOVEHS = 1 if the respondent has above higher secondary level of education,
=0 otherwise
(PRIMARY, i.e., respondent has primary level of education, is taken as reference category)
MUSLIM = 1 if the respondent is a Muslim; = 0 otherwise
HSC = 1 if the respondent is a Hindu schedule caste; = 0 otherwise HST = 1 if the respondent is a Hindu schedule tribes; = 0 otherwise
HOTHERS = 1 if the respondent belongs to all others socio-religious identity, = 0 otherwise
(HUC, i.e. Hindu forward castes, is the reference category)
UNEMP = State level unemployment calculated for rural/urban areas and by gender
Dummies representing occupational categories based on the National Classification of Occupation:
SJOBS = 1 if the respondent engaged in managerial, administrative and professional occupations; = 0 otherwise
CLERK = 1 if the respondent engaged in clerical jobs; = 0 otherwise
CRAFT = 1 if the respondent engaged in craft and manufacturing jobs; = 0 otherwise
(PRIMARY SECTOR, i.e., the respondent engaged in primary sector jobs, is the reference category)
According to Heckman (1979), if I use ordinary least square method here without addressing the incidental truncation3 of the data set, it will lead to biased estimates of the parameters. With respect to the elderly people, it is clear that if the market wage is higher than the reservation wage and if they have a compulsion, they will participate in the labour market. So, the data here is not random and besides, we are dealing with the truncated data set, as in the NSS data, the information on the earnings of informal sector workers is missing. So, to find out the effects of several variables, on the daily earnings of the elderly in six different geographical regions of India and at the same time to address sample selection problem, I have focused on the Heckman’s Sample selection model. Following the Heckman’s sample selection model here I have considered two equations.
In one equation outcome variable and its determinants are considered and in other equation, i.e., in selection equation, a portion of the sample whose outcome is observed and the mechanism determining the selection process is considered. In the context of earnings of elderly workers, the regression equation and selection equation are given below:
Regression equation:
LE = α + β1 AGE + β2 ILLITERATE +β3 BPRIMARY + β4 MIDDLE +β5 SECONDARY + β6 HS + β7 ABOVE HS + β8 MUSLIM + β9 HSC + β10 HST + β11 HOBC + β12 HOTHERS + β13 SJOBS+ β14 CLERK+ β15 CRAFT + β16 UNEMP
Selection equation:
WFORCE = α + β1 AGE + β2 ILLITERATE + β3 BPRIMARY + β4 MIDDLE + β5 SECONDARY +β6 HS + β7 ABOVEHS + β8 MUSLIM + β9 HSC + β10 HST + β11 HOBC + β12 HOTHERS + β13 UNEMP + β14 DEPENDENT
Where,
DEPENDENT= Number of non-aged non-working members Other variables are the same as previous equation (equation 1).
II Results and Discussions
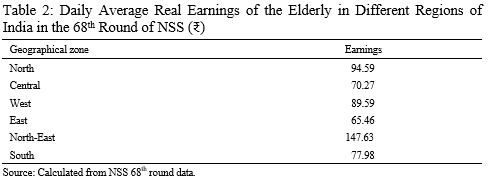
Table 2 depicts the daily average real earnings of the elderly in six different zones of India in 2011-2012. The highest earnings have been observed among the North-East Indian aged in the 68th round of NSS, followed by North Indian aged people and the least earnings are observed among the East Indian elderly. Except the North-East Indian elderly, in all other regions, average earnings of 60+ populations are not even ₹100 per day.
In the next part, I am going to analyse the earnings of the 60+ populations in six different zones of India across educational attainment of the elderly and also with respect to monthly per capita expenditure of the aged.
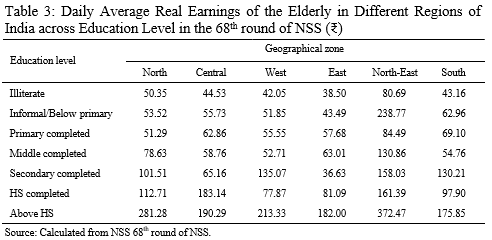
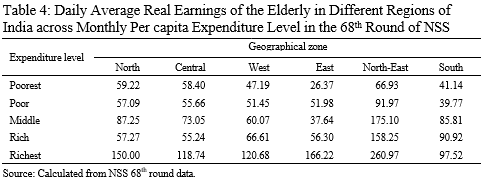
From the above table it is evident that except the North-East Indian elderly, in all other regions, daily average real earnings are almost same among the illiterate, below primary educated, primary educated and among the middle educated aged persons. From the secondary education level onwards, the variations in the daily average real earnings has been noticed across different regions. The elderly who live in North-East India, earn more than their counter parts in other regions of India. However, only in case of higher secondary educated, the Central Indian aged earns more than the North-East Indian elderly. Among the secondary educated, the least earnings have been found among the elderly who live in East India. The higher secondary completed West Indian elderly earn less than the elderly in other regions of India. The above-higher secondary educated South Indian elderly earn less than the aged people in other regions. In all the regions the aged people who are above higher secondary educated, earn more than the others. Another important factor that determines the earnings of the elderly is their monthly expenditure. Table 4 illustrates the association between the daily average real earnings and monthly per capita expenditure of the elderly in different regions of India. Considering all the regions across expenditure level, the highest earnings has been observed among the richest expenditure group. In the regions like North, Central, North-East the elderly who belongs to the rich expenditure group have lower daily average earnings compared to the middle expenditure group. Comparing the regions, it has been found that North-East Indian elderly earn more than the elderly in other regions of the country, considering all the expenditure levels. Among the poorest and middle expenditure group, East Indian elderly earns much less than the others. However, in case of poor expenditure group, the South Indian elderly have the least daily average real earnings. In case of rich and richest expenditure group, the least earnings have been observed among the Central and South Indian elderly respectively in 2011-2012.
After analysing the earnings of the elderly, considering quintile division of monthly their per capita expenditure, in the next part I am going to examine the earnings of the elderly across different socio-economic category in six different geographical zones.
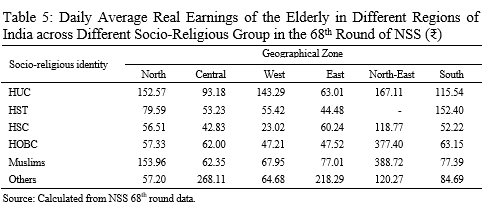
Table 5 illustrates that in North India, the Hindu Upper Caste and Muslim elderly have almost the same daily average real earnings in 2011-2012 and their earnings are higher compared to the other socio religious groups. In North India, the daily average real earnings of Hindu Schedule Caste is lower compared to the others in the 68th round of NSS. The elderly who belong to the Other socio- religious category earn more than the others in Central and East India in 2011- 2012. The earnings of Hindu Schedule Caste and Schedule Tribes are less compared to the others in Central and East India respectively in 2011-2012. Hindu Upper Caste elderly in West India earns more than the other socio- religious groups in the 68th round of NSS and lowest mean daily earnings have been found among the Hindu Schedule Caste. In North-East India, aged Muslims have the highest daily earnings. However, Hindu Scheduled Castes are getting lowest earnings in North-East zone. In South India, Hindu Schedule Tribes are experiencing highest earnings in the 68th round of NSS.
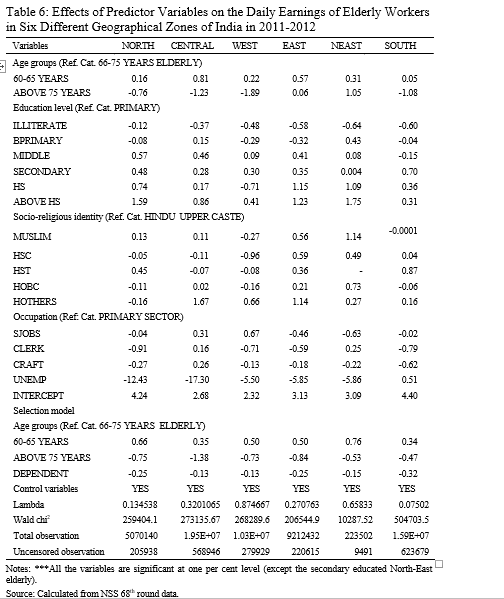
In the next part, I want to focus on the multivariate analysis. The results of econometric analysis (Table 6) depicts that the elderly 60-65 years get higher earnings compared to the middle aged elderly (66-75 years) in all the six geographical zones of India. However, the above 75 years elderly in East and North- East India are getting significantly higher earnings compared to the 66-75 years category of elderly. In all other zones, those above 75 years are getting lower earnings in 2011-2012. Level of education of the elderly in six different zones of India illustrates, as expected, that in all the regions the illiterate elderly are getting lower earnings compared to the primary educated elderly in 2011- 2012. Among the below primary educated elderly, ironically only the Central Indian and North-East Indian are getting higher daily earnings compared to the primary educated elderly in the 68th round of NSS. The middle educated elderly almost in all the zones (except the middle educated elderly in South India) and the elderly having secondary level of education in six geographical zones are getting higher earnings compared to the primary educated elderly in recent years. The higher secondary and above higher secondary educated elderly in all the zones get higher earnings compared to the primary educated elderly (except higher secondary educated elderly in West India). Table 6 also depicts that Muslim elderly people are getting higher daily earnings compared to the Hindu upper caste elderly in most of the zones in recent years. The North, Central and West Indian Hindu Schedule Caste elderly are getting lower earnings compared to the Hindu upper caste, however, we can observe opposite results among the East, North-East and South Indian Hindu Schedule Caste elderly. Except the Hindu Schedule Tribes in Central and West India, in most of the zones the Schedule Tribes, the elderly have higher earnings compared to the Hindu Upper caste in the 68th round of NSS. The elderly who belong to Other Backward Caste are getting higher earnings compared to the Hindu Upper Caste elderly in Central, East and North-East India in 2011-2012.
Occupational category of the elderly shows that only in Central and West India, the elderly who are in superior jobs are getting significantly higher daily earnings compared to the primary sector jobs. In North India, the elderly who are in clerical jobs or craft and manufacturing, are getting lower daily earnings compared to the primary sector jobs. However, in Central India we can observe the opposite scenario. In West India, the elderly in the primary sector are earning higher than their counterpart in clerical, craft and manufacturing sector in 2011- 2012. The East and South Indian aged people who are in primary sector are getting higher earnings compared to clerical jobs, craft and manufacturing jobs. In North –east India, we can see almost the same result as in the East and South India but the exception is the elderly who are in clerical jobs. Table 6 also illustrates, that with the increase in state level unemployment, the earnings of the 60+ populations decrease in all the geographical zones of India, except South India in the 68th round of NSS.
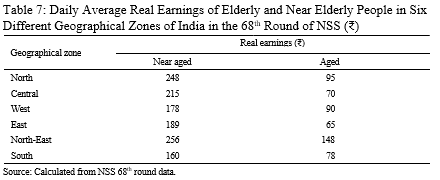
In the next part, I want to focus on the exploitation that the elderly people in India are facing in different geographical zones. Here, I will consider the earnings of elderly and near-elderly people (50-59 years). Table 7 depicts the daily average real earnings of elderly and near elderly people in different
geographical zones of India in 2011-2012. From the results we can observe significant earnings gap between elderly and near- elderly people in six different geographical zones. The earnings of the elderly people are very low compared to the near elderly people in all the regions of India in 2011-2012.
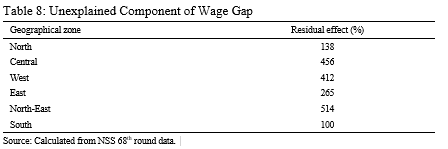
Now, these gaps in earnings between the above mentioned groups can be explained in terms of differences in education, other socio-economic variables etc. However, using Oaxaca and Blinder (1973) decomposition here, I want to examine whether there is any unexplained component of earnings gap that exits or not, between these two groups of people. Actually the unexplained component of earnings gap indicates the existence of discrimination in the market against the elderly people. Table 8 explains the discrimination that the elderly people in India are facing in 2011-2012 compared to near elderly people in different regions. It has been observed that in all the geographical zones the elderly people in India are facing discrimination in the labour market compared to the near elderly people in recent years. However, the highest discrimination has been observed among the North-East Indian elderly followed by Central Indian elderly in the 2011-2012. The South Indian elderly people are better off as they are facing lowest discrimination in the labour market in the 68th round of NSS.
II Conclusion
On analysing the earnings of the 60+ populations in recent years in different geographical regions of India, it has been observed that the North-East Indian elderly people are better off in terms of daily average real earnings compared to their counter parts in all other regions. Examination of earnings across educational attainment of the elderly population in India confirms no significant variations in earnings among the elderly who have a below secondary level of education across different geographical zones. Among the secondary and above higher secondary educated, the North- east Indian aged people are getting highest earnings in 2011-2012. However, daily average earnings of higher secondary completed Central Indian elderly are much higher than the others (who have completed higher secondary) in all other regions of India in the 68th round of NSS. From the analysis of monthly per capita expenditure, it is clear that North- East Indian elderly earns more than the others irrespective of expenditure level in 2011-2012. Among the rich expenditure groups, least earnings have been noticed among the Central and South Indian elderly in the 68th round of NSS.
Multivariate analysis explains that with the increase in age, earnings of the elderly decreases in all the regions of India in the 68th round of NSS. Only exceptions are East and North-East Indian above 75 years elderly because their earnings are higher than the 66-75 years aged people in India in 2011-2012. An inverse relation between state level unemployment and daily average real earnings of the elderly has been observed in India in most of the regions in the 68th round of NSS. Education level, as expected, confirms that almost in all the zones, secondary, higher secondary and above higher secondary, the educated 60+ populations are getting significantly higher daily earnings compared to the primary educated elderly in 2011-2012. Among different socio-religious group in India in the 68th round of NSS, Muslim elderly in almost all the zones, earns more than the Hindu Upper caste aged people. Hindu Schedule caste 60+ populations are better off than the Hindu Upper caste elderly in terms of daily average real earnings in 2011-2012. Except the Central and West Indian aged, among the Hindu Schedule tribes, the aged in all other regions we can observe similar results as in case of Hindu Schedule caste viz-a-viz Hindu Upper caste in the 68th round of NSS. In this paper, I have taken different occupational categories and the results depict that in most of the zones, the elderly who are in superior jobs, clerical jobs, craft and manufacturing jobs, earn significantly lower than the elderly who are in primary sector in India in the 68th round of NSS. A significant wage gap between the earnings of elderly and near elderly has been noticed in all the geographical zones of India in recent years. Following the Oxaca-Blinder decomposition, I have found that North-East Indian elderly people are facing the highest discrimination in the labour market in 2011-2012 followed by the Central Indian 60+ populations.
Summing up, I have observed that while the aged people in North-East India have the highest daily average real earnings in recent years they are also
facing the highest discrimination in the labour market. In most of the geographical regions, an inverse relation between age and daily average real earnings has been noticed. As expected the higher educated category earns more than the primary educated one in most of the zones. In the 68th round of NSS, the Muslims and Hindu Schedule Caste elderly people earn significantly more than the upper caste Hindu in most of the geographical zones of India. Another important finding is that almost in all the zones, the primary educated aged people earn significantly higher than the elderly who are in superior jobs, clerical, craft and manufacturing jobs in 2011-2012 in India.
Endnotes
1. In India, the elderly population exceeded the proportion of seven per cent of the total population in 2009 (Subaiya and Bansod 2011) and is expected to reach 12.6 per cent in 2025 (Prakash 1999). In 2050 it is projected to increase to 20 per cent (Subaiya and Bansod 2011).
2. The sampling design adopted for the NSS survey were essentially a stratified multi-stage one for both rural and urban areas. The survey used the interview method of data collection from a sample of randomly selected households. The first stage units (FSUs) were villages (panchayat wards for Kerala) for rural areas and NSSO Urban Frame Survey (UFS) blocks for urban areas. The ultimate stage units (USUs) were households.
3.Sample selection or incidental truncation refers to a sample that is not randomly selected.
References
Auer, P. and M. Fortuny (2000), Ageing of the Labour Force in OECD Countries: Economic and Social Consequences, Geneva: International Labour Office, Employment Paper.
Becker, G.S. (1964), Human Capital: A Theoretical and Empirical Analysis with Special Reference to Education, Chicago: University of Chicago Press for the National Bureau of Economic Research.
Gelderblom, A. (2005), The Relationship of Age with Productivity and Wages, Rotterdam: SEOR. Heckman, J.J. (1979), Sample Selection Bias as a Specification Error, Econometrica,
47(1): 153-161.
Krug, E.G. (2002), World Report on Violence and Health, Geneva: World Health Organization. Leslie, D., D. Blackaby, P. Murphy and N.O. Leary (2009), The Employment and Earnings of
Britain’s Senior Citizens, Economic Issues, 14(2): 1-25.
Mahmood, R.A., S. Begum and A.B.M.S. Islam (2008), Bangladesh, In Rajan S.I. (Eds.): Social Security for the Elderly: Experiences from South Asia, New Delhi: Routledge, pp. 163-224.
Murozumi, M. and M. Shikata (2008), The Structure of Income in Elderly Households and Relative Poverty Rates in Japan from the Viewpoint of International Comparisons, Luxembourg: Luxembourg Income Study, Working paper no. 483.
Perera, M., A. Gunawardena, P.P.M. Gunatilaka (2008), Srilanka, In Rajan S.I. (Eds.): Social Security for the Elderly: Experiences from South Asia, New Delhi: Routledge, pp. 225-277.
Prakash, I.J. (1999), Ageing in India, Geneva: World Health Organization.
Rajan, I.S., P.S. Sarma and U.S. Mishra (2008), Demography of Indian Ageing, 2001–2051,
Journal of Ageing and Social Policy, 15(2-3): 11-30.
Raju, S. Siva (2011), Studies on Ageing in India: A Review, UNFPA, Working Paper 2.
Selvaraj, S., A. Karan and S. Madheswaran (2011), Elderly Workforce Participation, Wage Differentials and Contribution to Household Income, UNFPA, Working Paper 4.
Subaiya, L. and D.W. Bansod (2011), Demographics of Population Ageing in India, New Delhi: UNFPA, Working Paper 1.
UNFPA (2012), Report on the Status of Elderly in Selected States of India, 2011, New Delhi: United Nations Population Fund.
United Nations Population Division (2002), World Population Ageing: 1950-2050, New York: UN Population Division.
———- (2005), Population Challenges and Development Goals, New York: UN Population Division.
———- (2009), Population Ageing and Development 2009, New York: UN Population Division.