Household Food Consumption Patterns and Food Security in Uttar Pradesh, India
March 2024 | Neha Sikarwar and Jyoti Gogia
Abstract
Demand for food in India is increasing due to population growth and changing lifestyles. The main concern is to provide enough food, in quantity and quality, to meet the food and nutritional requirements of the population in a sustainable way. The study revealed that the food security level of households is positively associated with income, educational status, and area of land ownership, whereas it is negatively associated with the number of dependents in a family. Among the four selected areas of Uttar Pradesh, the food security level is found to be the highest in the western urban Uttar Pradesh due to favourable existence of its determining factors. The results also exposed that the people of western urban Uttar Pradesh are highly satisfied with their quality-of-life parameters and food consumption patterns.
Key Words
Food consumption patterns, Food security, Dietary diversity,Quality of life.
I Introduction
Food is the necessity of all living beings to survive. The formal adoption of the Right to Adequate Food by the World Food Summit in 1996 implemented the rights-based approach to world food security. According to the World Food Summit (1996), “the food security exists when all people, at all times, have physical and economic access to sufficient, safe and nutritious food that meets their dietary needs and food preferences for an active and healthy life.”
The connotation of food security has strengthened considerably over time. Initially, the concept of food security was restricted to food availability, however, later it has transformed into food and nutrition security, and it is said to be achieved, if “adequate food (quantity, quality, safety, socio-cultural acceptability) is available and accessible for and satisfactorily utilized by all individuals at all times to live a healthy and happy life” (FAO, 2000). Thus, food security has four dimensions: availability, accessibility, utilization, and stability. Assessment of consumption patterns along with the level of food production and households’ income is crucial as it affects utilization (adequacy of nutrition intake) and stability (year-round) dimensions of food security.
Despite the high-end technology and economic development, countries are struggling hard to ensure food security for all (Tanksale and Jha 2015). India is facing similar challenges. Over the past two decades, the Gross Domestic Product of India has increased by 4.5 times, the production of food grains has increased almost twice, and the per capita consumption has increased by three times (IFBN, 2020). But, due to the increasing population of the country, a substantial part of it does not have adequate access to food despite the impressive agricultural and overall economic growth of the nation (UNICEF, 2019). The present study aims to empirically investigate the various aspects of households’ food consumption patterns and the status of food security in Uttar Pradesh.
II Materials and Methods
Description of the Study Area
Uttar Pradesh is India’s fourth-largest state by land area. It is in the north-central part of the country. The state is divided into 18 divisions and 75 districts. The agriculture sector is the prime mover of economic growth in Uttar Pradesh and a vast section of its population relies on this sector for their livelihood. Due to the significant impact of the Green Revolution, Uttar Pradesh is the most prosperous, developed, and agriculturally rich region of India (Sebby 2010). Moreover, being the most populated state of India (Census, 2011), it requires enough food to maintain the well-being of people.
Sampling Procedure
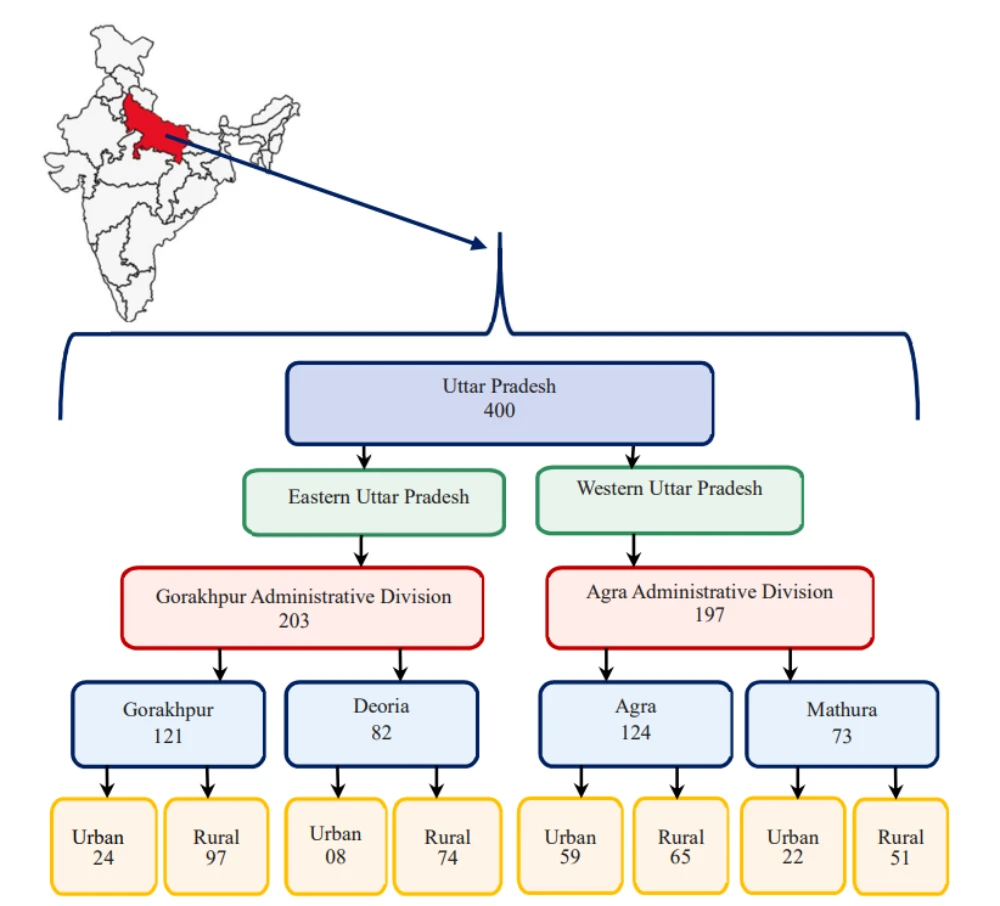
To conduct a comprehensive study, Uttar Pradesh has been divided into two zones – eastern Uttar Pradesh and western Uttar Pradesh. Two administrative divisions – Gorakhpur and Agra have been selected randomly from eastern Uttar Pradesh and western Uttar Pradesh respectively. From each administrative division, two districts were randomly selected, viz., Agra and Mathura districts from the Agra administrative division and Gorakhpur and Deoria districts from the Gorakhpur administrative division. Considering the gap between the rural and urban households, the samples have been taken from both, separately, on a random basis. The sample size determination was based on the finite population correction factor, and a sample of 400 households was drawn randomly according to the proportion of the size of the stratum as given below:
Sampling Distribution (Uttar Pradesh)
Statistical Tools/ Techniques
For the data analysis and to obtain valid and reliable results, the following statistical tools and techniques have been used:
Household Food Security Survey Module (HFSSM)
Household Food Security Survey Module is an 18-item USDA (United States Department of Agriculture) questionnaire, which is used to measure household food security on a recall period of 12 months. It is a linear and continuous scale that determines the severity of household food security level in a single numeric value ranging between 0-18 which is classified into four categories, viz., food secure (scores 0-2), food insecure without hunger (scores 3-7), food insecure with mild hunger (scores 8-12) and food insecure with intense hunger (scores 13-18).
Household Dietary Diversity Score (HDDS)
A Household dietary diversity score is used to analyse the diverse diet of households. It comprises 12 food groups. The scale is administered on a reference period of the last 24hours. Dietary diversity helps to know the nutrient adequacy and variation in an individual’s diet. It signals the quality of the diet of an individual. Its indicators also validate as a proxy for socio-economic status.
Food Consumption Score (FCS)
Food Consumption Score provides a composite score of household dietary diversity based on nine broad food groups (staples, pulses, fruits, vegetables, meat and fish, dairies, sugar, oil and fat, condiments) and their consumption frequencies in the past seven days. The food groups are weighted according to their nutritive relevance. To calculate a composite score, the standardized weights are multiplied by their related eating incidence in the past seven days. Based on this score, the food consumption status of a household is classified into one of three categories: poor (0-21), borderline (21.5-35), or acceptable (>35). Thus, the food consumption score can be considered a representative (proxy) indicator of caloric availability in a particular household.
Binary Logistic Model
Binary Logistic Regression is an extended version of simple linear regression that is when the dependent variable is binary (dichotomous) in nature. The binary logit model can predict the relationship between the independent and dependent variables.
Likert Scale
A five-point Likert scale (1to 5) has been used to know the level of respondents’ satisfaction regarding various dimensions of food consumption patterns and food security. Five points of the scale were 1- highly dissatisfied, 2- dissatisfied, 3- neither satisfied nor dissatisfied, 4- satisfied, and 5- highly satisfied.
For Testing Propositions
The Kruskal Wallis H test is used for testing propositions. The Kruskal Wallis H test is a non-parametric statistical tool that is used to test whether the medians of two or more than two populations are significantly different from each other or not.
Period of the Study
The period for the primary data collection was 2018-2019.
III Results and Discussions
Demographic and Socio-Economic Profile of Respondents
The demographic and socio-economic features (Table 1) affect the attitude, behaviour, and activities of the individuals and families. It reveals the various traits viz. age, gender, marital, educational, and employment status of respondents.
Table 1: Demographic and Socio-Economic Profile of Respondents
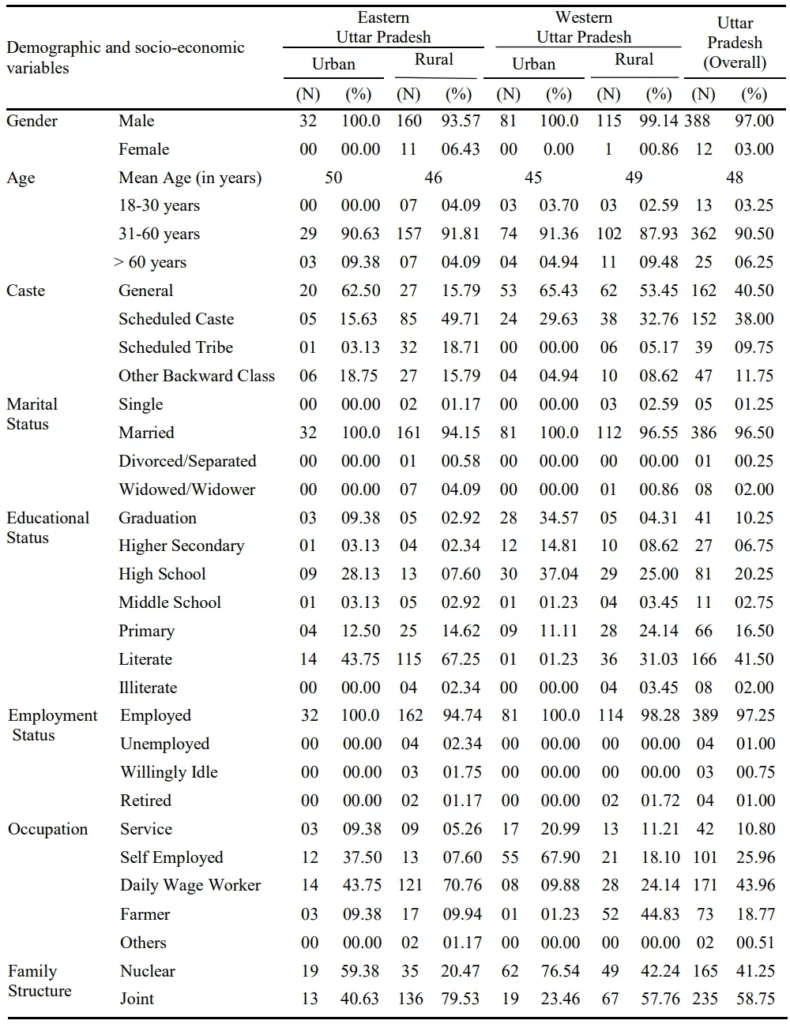
It has been found that most of the household heads were males (97 per cent) and males are still considered the breadwinners of the family. The mean age of the household head was 48 years. While categorizing data, it was found that a significant proportion of respondents (90.5 per cent) belong to the age group of 31-60 years. Indian society is divided into various castes, customs, and traditions, which have a broader impact on an individual’s life. Respondents from all classes, viz., 38.0 per cent from scheduled caste, 40.50 per cent from general category,
9.75 per cent from the scheduled tribes, and 11.75 per cent belonged to other backward class have been considered for the study. The majority of the respondents (96.5 per cent) were married. Overall, 41.5 per cent of respondents were literate with no formal education. Rural people are educationally backward as compared to their urban counterparts. Parents of western Uttar Pradesh were found more inclined towards sending their children for formal education.
The expenditure behaviour primarily depends upon the level of income. A significant proportion of the respondents (97.25 per cent) were employed out of which, 43.96 per cent were daily wage earners, 25.96 per cent were self-employed,
18.77 per cent were farmers, 10.8 per cent were working in service sector, and the remaining were engaged in other kinds of jobs. A gradual shift from a joint family system to a nuclear family system can be observed especially in urban areas. This inclination is for the sake of attaining financial stability, personal and academic development. 58.75 per cent of sample households had a joint family system. The joint family system still has its existence in rural settlements. Thus, considering the rural areas, 57.76 per cent of people of western rural Uttar Pradesh and 79.53 per cent of people of eastern rural Uttar Pradesh were living in joint families.
Family Composition, Level of Income and Credit Status
The issue of food security becomes critical when the population grows rapidly, especially the number of dependents. The average number of dependents per household in Uttar Pradesh was 7.10, with an average of 3.40 children per family. Eastern rural settlements of Uttar Pradesh had the highest average number of dependents per family (7.80), followed by western rural Uttar Pradesh (7.20), Eastern urban Uttar Pradesh (6.60), and the western urban Uttar Pradesh (4.90). The figures certainly illustrate the lack of family planning practices in rural settlements. A low level of income with a noticeably high number of dependents is a burden on the earning hands of households.
Table 2: Family Composition and Level of Income
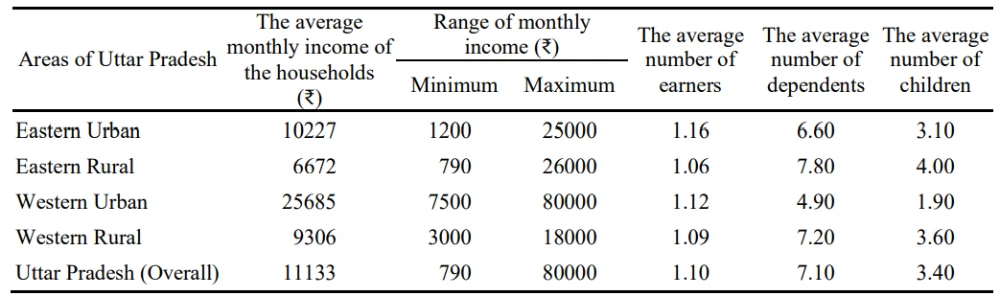
Income is an important aspect of determining the expenditure capacity of a family. The accessibility dimension of food security is directly linked to the income level of households. As depicted in Table 2, the highest average monthly household income was found in western urban Uttar Pradesh (₹25,685) followed by eastern urban Uttar Pradesh (₹10,227), western rural Uttar Pradesh (₹9306), and eastern rural Uttar Pradesh (₹6,672), respectively.
An inadequate financial state leads to borrowing from various sources. Due to time-consuming long procedures, tedious documentation, and inadequate coverage of institutional sources, more than 60 per cent of respondents of eastern urban and rural and western rural Uttar Pradesh rely on non-institutional sources of credit and they get exploited in various ways. In contrast, people in western urban Uttar Pradesh (86.66 per cent) were found to be more aware and they approached the institutional credit sources. Commonly, in case of food insufficiency, households borrow (59 per cent) from other persons (Gupta A. and Mishra D.K. 2018). Overall, 51.5 per cent of respondents agreed that they took loans specifically to arrange food for their family. Most of the respondents (73.10 per cent) of eastern rural areas took loans for food purpose followed by western rural areas (51.72 per cent), eastern urban areas (34.38 per cent), and western urban areas (12.35 per cent) of Uttar Pradesh.
Agriculture and Allied Activities
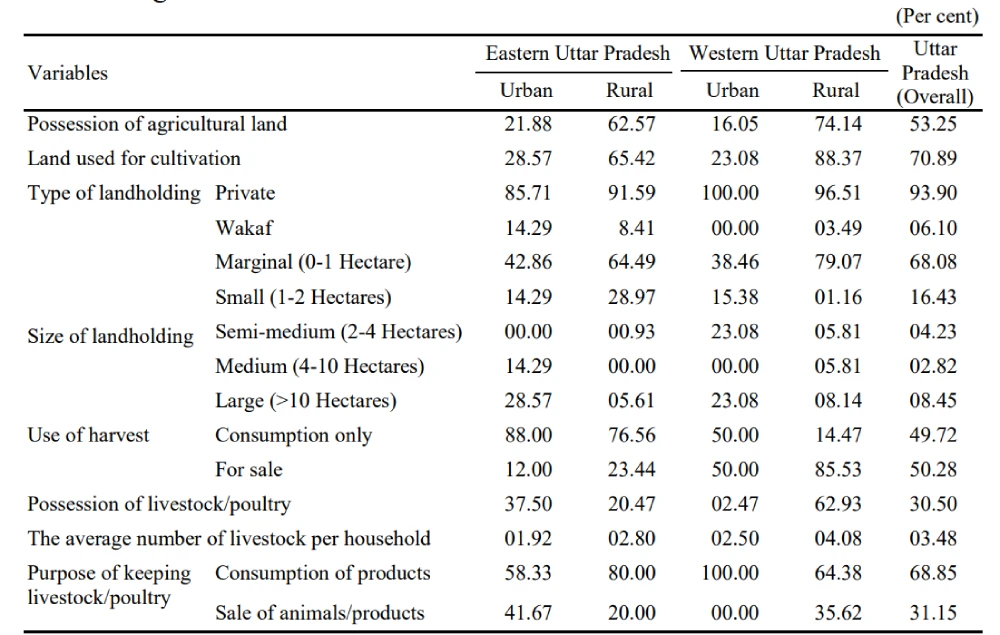
Agriculture and allied sectors have crucial roles in ensuring food security by increasing the quantity of diversified food. Goli, Rammohan, and Reddy (2021) reported that 94 per cent of all food-insecure households possess no or marginal agricultural landholding. The probability of food insecurity for households with no agricultural landholding is four times higher compared to medium-to-large agricultural landholding. The livestock, along with agriculture, is helpful in making a powerful food system. Approximately, 53.25 per cent of respondents possess agricultural land, out of which 29.11 per cent do not use it for cultivation (Table 3). Most of the respondents (84.51 per cent) had marginal and small landholdings. However, 49.72 per cent of the produce is used for self- consumption. The subsistence level of farming does not help to generate a significant income, and hence the farmers, despite being the producers of the food, are not able to access the diversified food products.
Table 3: Agriculture and Allied Activities
Status and Households’ Satisfaction Regarding Quality-of-Life Parameters
Good living and dwelling conditions determine the quality of life through happiness and contentment of people. Table 4 depicts the dwelling and living conditions of households in Uttar Pradesh.
Table 4: Dwelling and Living Conditions of Households
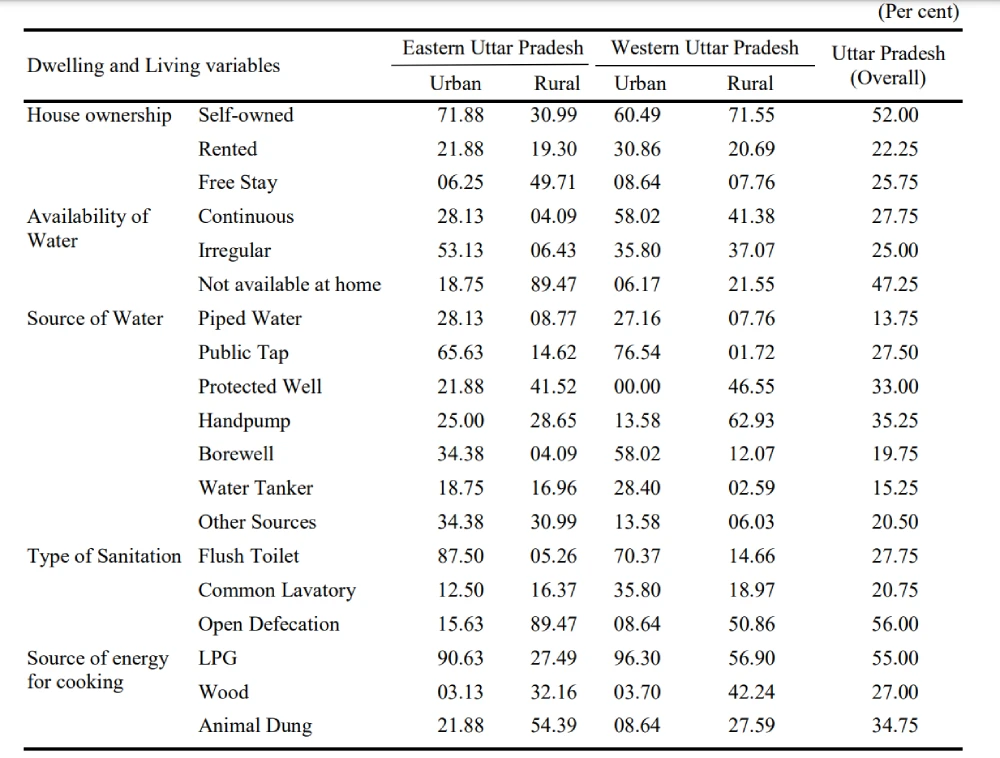
Fifty-two per cent of respondents had a self-owned home, but only 27.8 per cent receive a continuous water supply. It is a problem specifically in the rural areas of Uttar Pradesh, where people are still using hand-pumps as a significant source of water. On the other hand, urban people have accustomed themselves towards using the bore-well and public taps. The government’s attempts of providing clean and safe drinking water to all seem inadequate. It is remarkably noticed that despite big efforts of government to make India an open-defecation free nation, it has been found that 56.0 per cent of households in Uttar Pradesh are still practicing defecation in open areas. In rural areas, people are still using animal dung and wood to cook food.
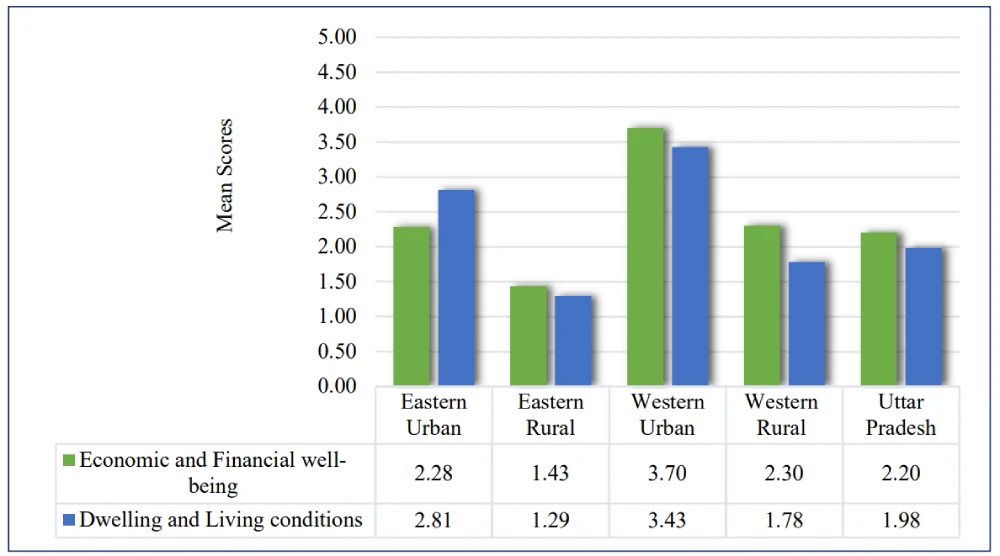
Figure 1 shows that only the people of western urban Uttar Pradesh are satisfied with their economic and financial well-being and dwelling and living conditions. The dissatisfaction level is maximum in case of people of eastern rural Uttar Pradesh. The satisfaction level is comparatively higher in case of urban areas rather than the rural areas.
Figure 1: Households’ Satisfaction Level Regarding Economic and Financial Well-being and Dwelling and Living Conditions
The Kruskal-Wallis H test was used to determine whether there lies a statistically significant difference between the level of satisfaction regarding the dwelling and living conditions and economic and financial well-being among the households of four areas of Uttar Pradesh. The results as indicated in the table 5 have the value of KWH=228.188 for dwelling and living conditions and 227.176 for economic and financial well-being with degrees of freedom=3 and N=400. Enough statistical evidence exists to conclude that there is a significant difference between the level of satisfaction regarding the dwelling and living conditions and economic and financial well-being among the households of all four areas of Uttar Pradesh. Therefore, we reject the null hypothesis.
Table 5: Hypotheses Analysis Results for Overall Households’ Satisfaction Level
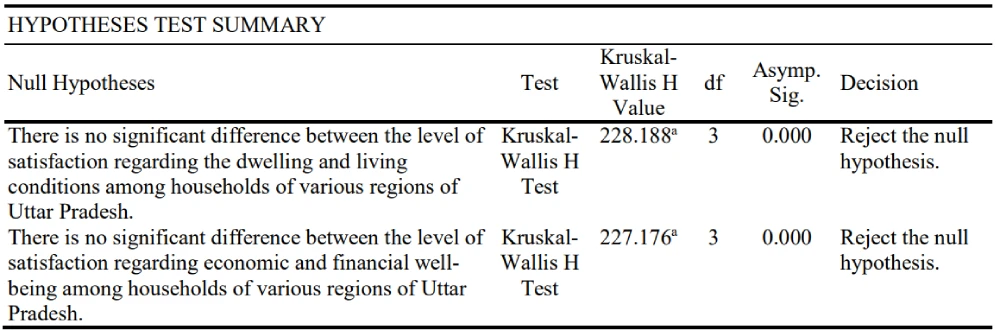
Table 6: Pairwise Comparisons of Households’ Satisfaction Level
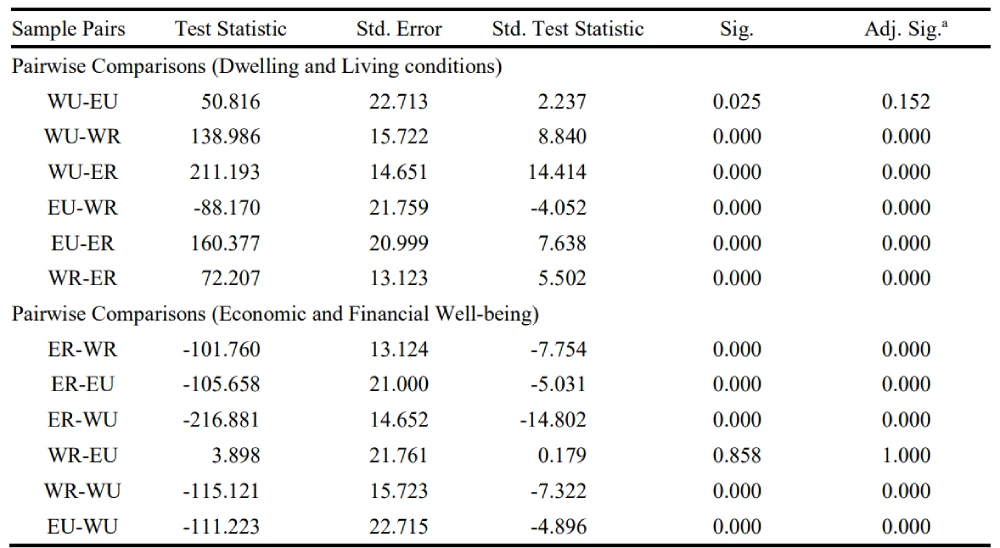
Table 6 depicts the pairwise comparison of the four areas of Uttar Pradesh and estimates the significance value of six possible pairs of the sample. The adjusted significance values of highlighted regions are significantly less than the p-value, i.e., 0.05. Therefore, these are the dominant pairs across the matrix because of which the proposed null hypothesis has been rejected. Here, five dominant pairs were identified based on p-value, which substantially steered more arguments regarding the dwelling and living conditions and economic and financial well-being than their counterparts.
Household Food Consumption and Expenditure Summary
One of the important dimensions of food security is the food consumption patterns of households. The eastern and western Uttar Pradesh has a clear distinction in food choices. The majority of respondents have a non-vegetarian diet in eastern Uttar Pradesh. On the other hand, a vegetarian diet is the preference of respondents of western Uttar Pradesh.
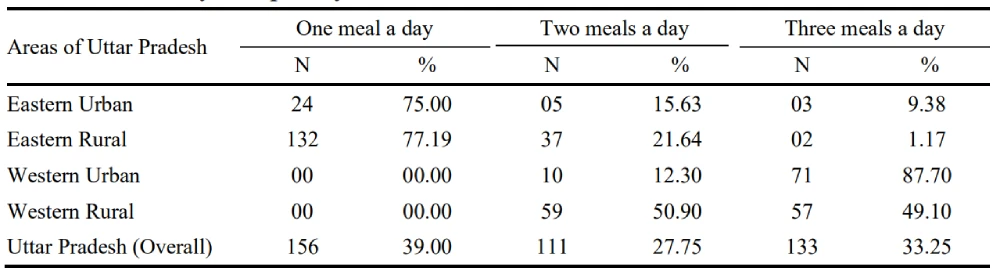
Table 7 depicts the per-day frequency of meals. In eastern rural and urban areas of Uttar Pradesh, 77.19 per cent and 75 per cent of respondents consumed one meal per day respectively and a marginal proportion of respondents had three meals a day. 50.90 per cent of respondents consumed two meals a day in western rural Uttar Pradesh. However, in western urban Uttar Pradesh, 87.7 per cent had three meals a day. It can be concluded that people of western urban Uttar Pradesh are getting their meals adequately.
Table 7: Per-Day Frequency of Meals
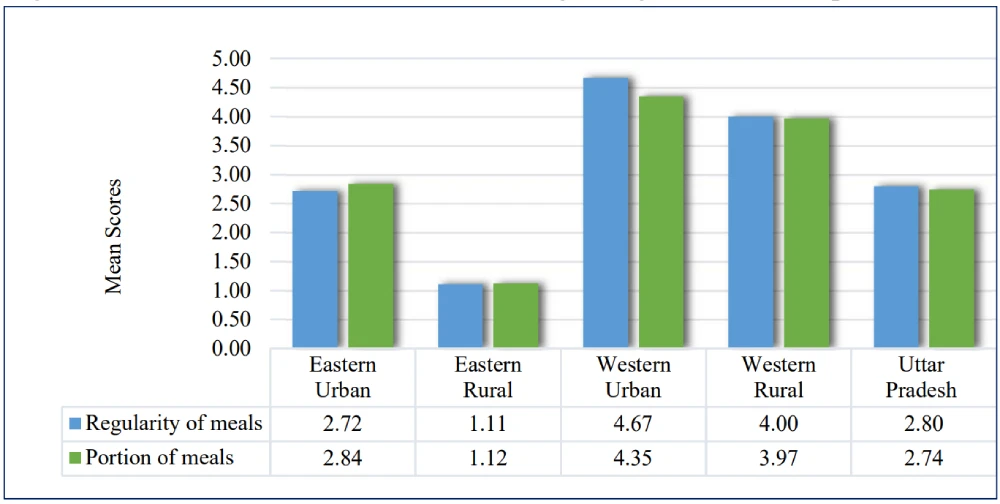
The level of satisfaction related to food consumption at the household-level is portrayed in Figure 2. As considered the regularity and size of meals, it has been found that the people of western urban Uttar Pradesh were highly satisfied. The highest dissatisfaction level was found in people of eastern rural Uttar Pradesh.
Figure 2: Households’ Satisfaction Level Regarding Food Consumption Patterns
The Kruskal-Wallis H test was used to determine whether there lies any statistically significant difference between the level of satisfaction regarding the regularity of meals and meal portion size among the households of four areas of Uttar Pradesh. The results indicated the value of KWH = 346.135 regarding regularity of meals and 327.358 related to meal portion size with degrees of freedom=3, N=400. Enough statistical evidence exists to conclude that there is a significant difference between the level of satisfaction regarding the regularity of meals and meal portion size among the households of all four areas of Uttar Pradesh. Therefore, we reject the null hypothesis.
Table 8: Hypotheses Analysis Results for Households’ Satisfaction Level Regarding Food Consumption Patterns
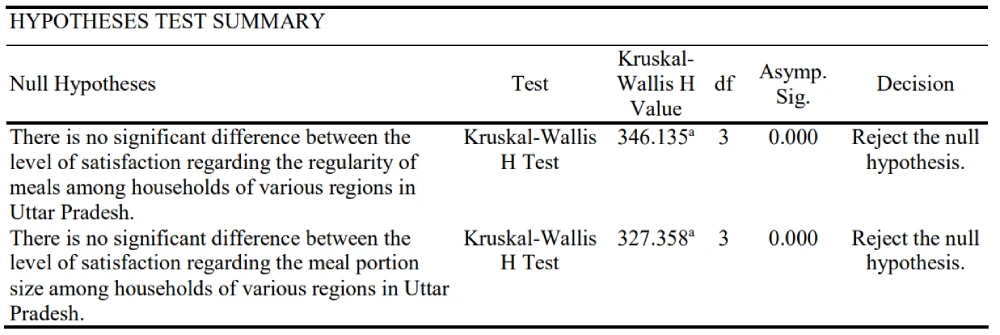
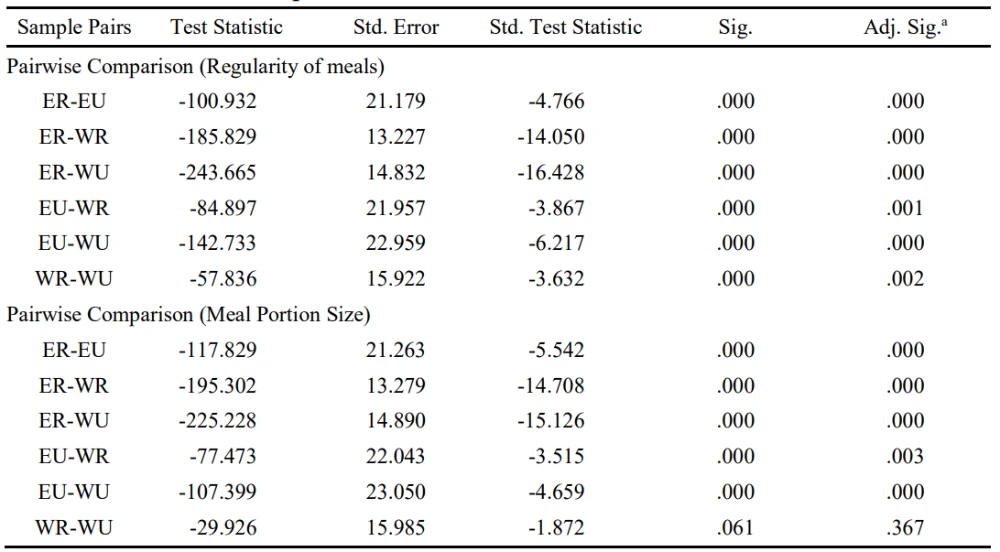
Table 9 depicts that the adjusted significance values of all six pairs regarding regularity of meals are less than the ∞=0.05, which basically suggests that these are the dominant pairs across the matrix due to which the proposed null hypothesis was rejected. Hence, all six pairs were dominant which substantially steered more arguments regarding the regularity of meal than their counterparts. Regarding meal portion size five dominant pairs were found due to which the proposed null hypothesis was rejected, and which substantially steered more arguments regarding the meal portion size than their counterparts.
Table 9: Pairwise Comparisons of Households’ Satisfaction Level
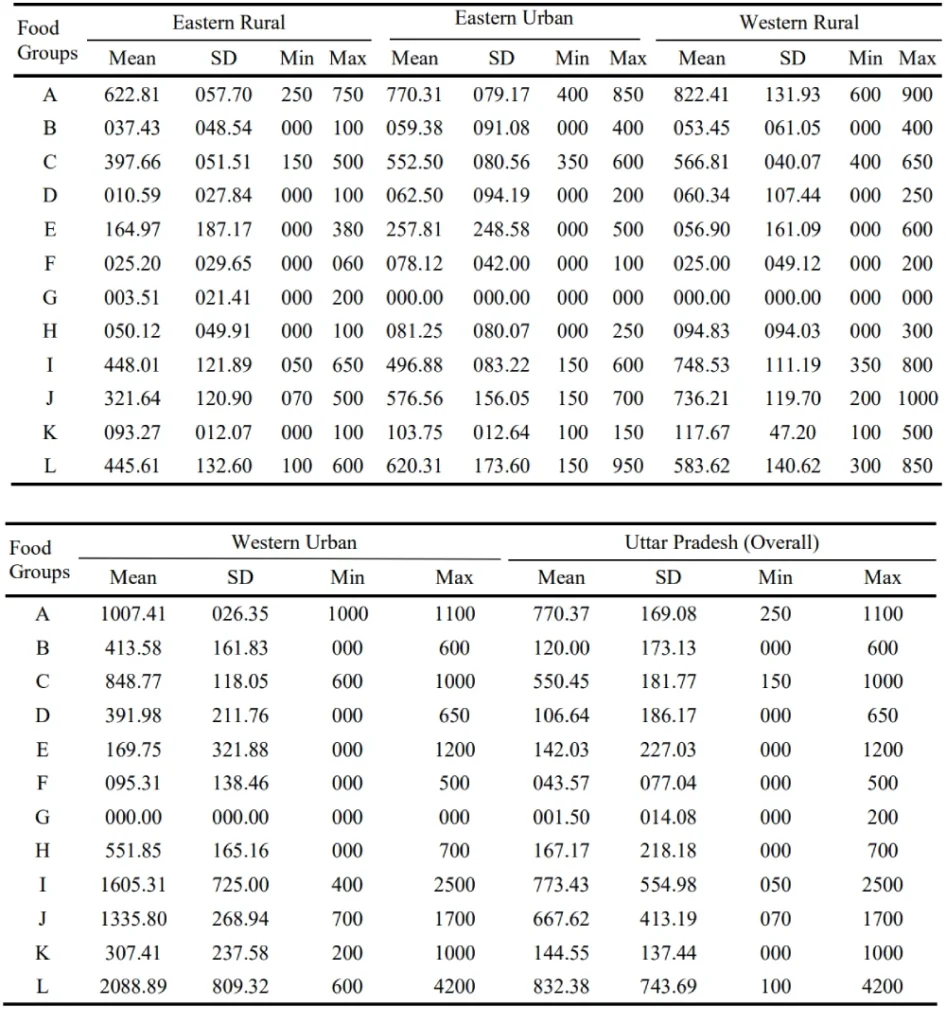
The households’ monthly food expenditure is summarized in the table 10. It presents 12 food groups and the average spending on each food group. Majority of food budget was spent in acquiring of the cereals in case of the households of eastern rural, eastern urban and western rural Uttar Pradesh. On the other hand, in case of western urban Uttar Pradesh, majority of budget was spent in procuring the miscellaneous food items. However, the minimum expenditure done upon roots and tubers, fruits, meat/poultry/offal, egg, fish/seafood and pulses/legumes/nuts, was found as low as zero.
Table 10: Households’ Monthly Expenditure on Major Food Items
Household Dietary Diversity Score
Household dietary diversity score is used to analyse the diversified diet consumed by the households. Its indicators also validate as a proxy for the socio-economic status. Cereals were consumed by every household. It is worth mentioning that keeping in view the diversity of food products to maintain adequate nutritional level; it was found that the households do not consume diversified products, especially fruits and pulses/legumes/nuts. The low percentage of category E, F and G in table 11 is due to the presence of vegetarian households who do not consume food items of these groups.
Table 11: Diversity in Food Consumption
(Association between consumption of different food groups and area of residency)
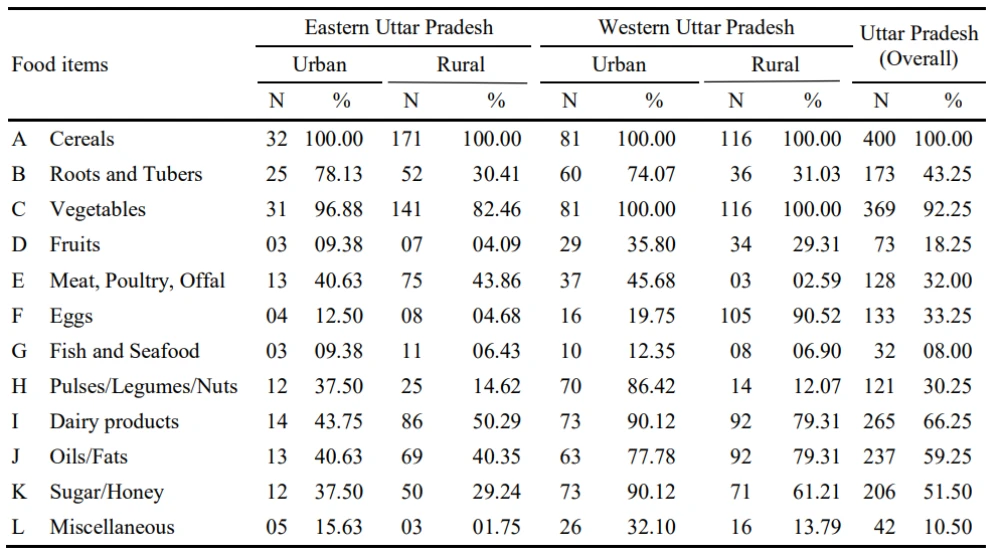
Table 12 exhibits three mutually exclusive dietary diversity categories, such as: Low dietary diversity (score 0-3); Medium dietary diversity (score 4-5); High dietary diversity (score 6 & above).
Table 12: Status of Households’ Dietary Diversity
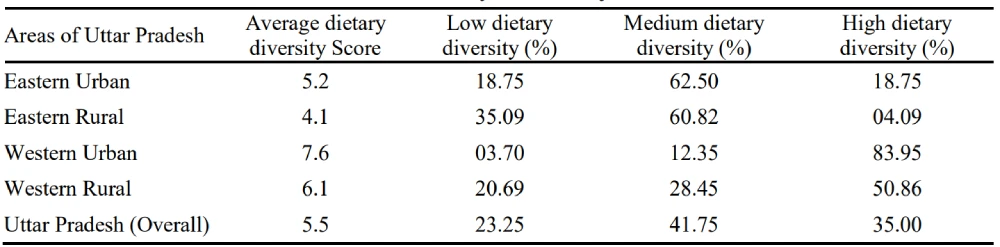
The average dietary diversity score of households of Uttar Pradesh (overall) falls in the medium dietary diversity category (score value is 5.5). The majority of households of western areas of Uttar Pradesh fall in the category of high dietary diversity, whereas most of the households of eastern areas of Uttar Pradesh fall in the medium dietary diversity category. Households of eastern rural Uttar Pradesh received the lowest average dietary score in comparison to the households of all other areas.
Food Consumption Score
Thresholds for food consumption score were established by the United Nations World Food Programme (WFP) in order to classify the households under assorted dietary diversities. Food Consumption Score ≤ 21 is a bare minimum score categorized as “poor” because it reflects that a household is not even getting staples and vegetables to eat, daily. The Food Consumption Score between 21.5- 35 is considered as “borderline” and the Food Consumption Score ≥ 35 is considered as “acceptable” (World Food Programme, 2008).
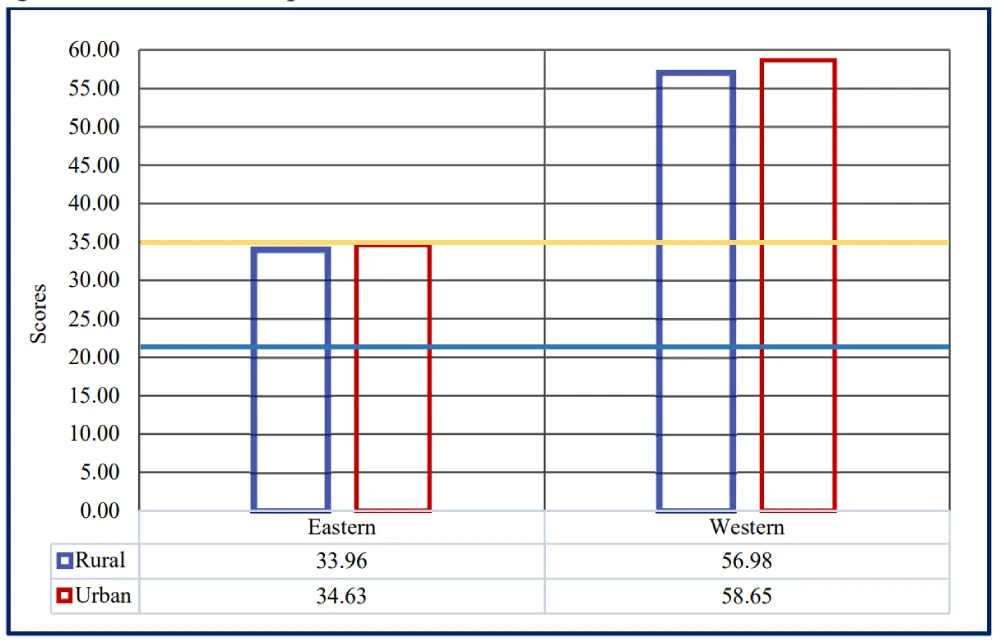
The food consumption score of Uttar Pradesh (overall) was calculated to be 45.7 (n=400) which is acceptable as per the thresholds. The households of western Uttar Pradesh fall in the acceptable category of food security (FCS ≥ 35), whereas the households of eastern Uttar Pradesh belong to the borderline category (FCS ranges in between 21-35).
Figure 3: Food Consumption Score
Households’ Food Security
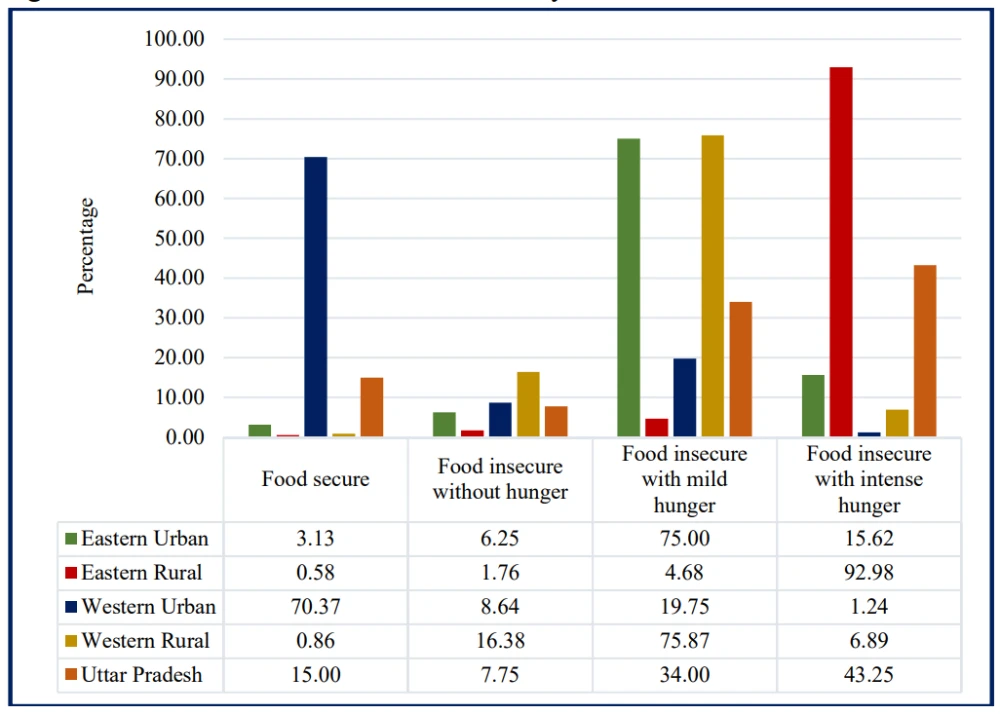
Figure 4 represents the households’ food (in) security status in Uttar Pradesh. Overall, majority of the households (43.25 per cent) belong to the category of food insecurity with intense hunger, whereby the percentage of households of eastern rural Uttar Pradesh (92.98 per cent) is maximum among all four areas. Only 15 per cent of overall respondents are food secure and the highest number of food secure households (70.37 per cent) belong to the western urban Uttar Pradesh. The other three areas denote significantly less percentage of food secure households. Approximately, 75 per cent of households of eastern urban and western rural areas of Uttar Pradesh belong to the category of food insecurity with mild hunger.
Figure 4: Level of Households’ Food Security
Determinants of Food Security
To estimate the various food security determinants, the binary logistic regression technique was used. It maximizes the probability of classifying the observed data into the appropriate category, given the regression coefficients. There exists an assumption of linearity between the dependent variables and the log-odds (also called logit) of the event that can be expressed in the following mathematical form
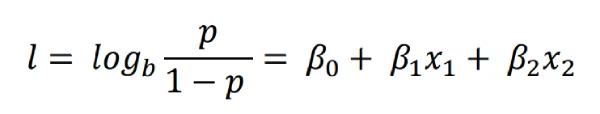
Where, β = parameters of the model and l = log odds.
Table 13: Description of the Logistic Regression
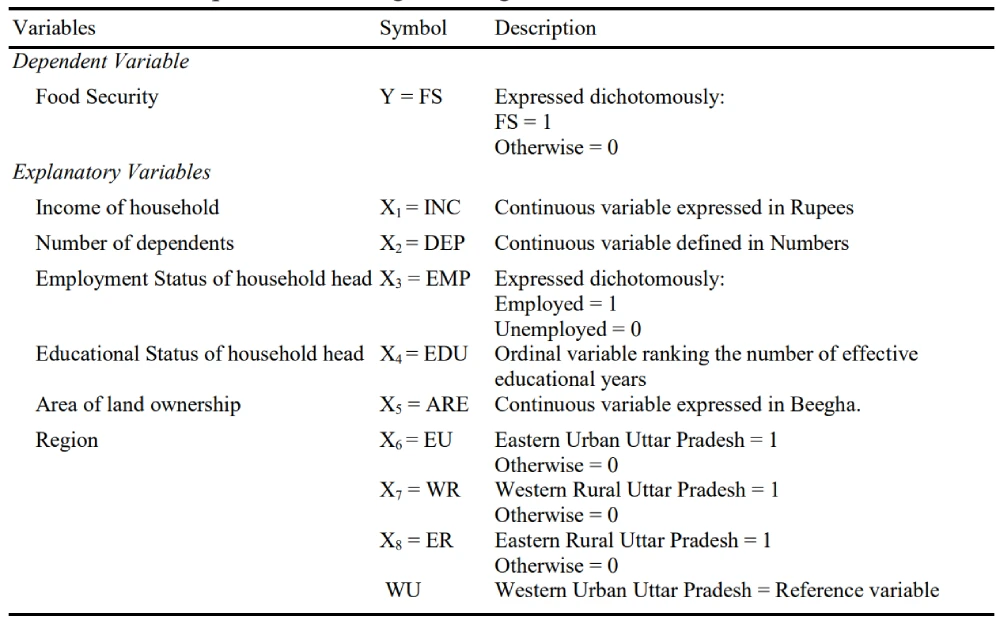
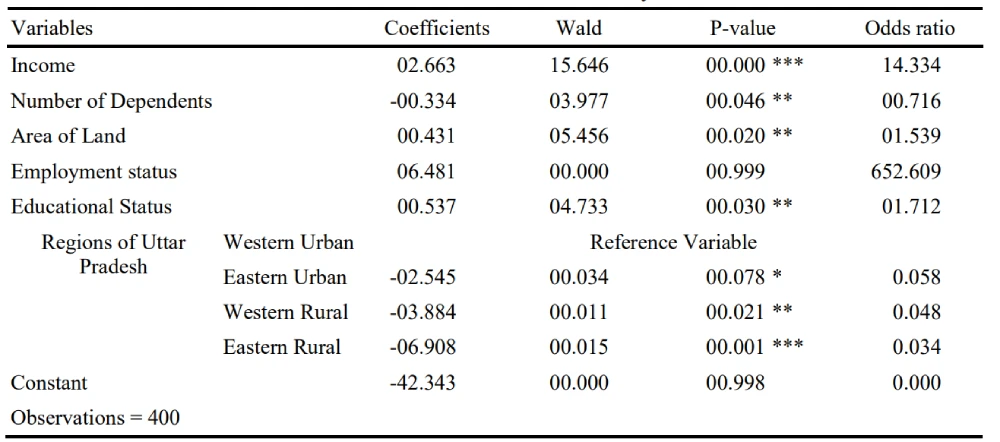
To determine the status of food security among the sample households (400), the USDA Household Food Security Scale was used. With the help of the Household Food Security Scale calculations and standard thresholds, the households were divided into dichotomous categories – Food secure and Food insecure households. The variables of regression model are expressed in table 13. Table 14 represents the parameter estimates of determinants of household food security. There are statistically significant associations between food security and various terms (income, number of dependents, educational status, area of land ownership, and region) except the employment status of household head. It was found that income, educational status, and area of land ownership are positively associated with the food security level, whereas the number of dependents has been inversely associated with the food security level. Among the four regions of Uttar Pradesh, the food security level is found to be the highest in the western urban Uttar Pradesh due to favourable existence of determining factors. Residing in western urban Uttar Pradesh has a positive and significant impact in realizing the level of food security as compared to that residing in the eastern urban, western rural and eastern rural Uttar Pradesh respectively.
Table 14: Determinants of Households’ Food Security
IV Conclusions
Food has a great impact on our daily life. Not only does it provide satisfaction to an individual, but also it helps to keep oneself connected with community and culture. As per Maslow’s hierarchy of needs, food is one of the foundational requirements for human well-being. Uttar Pradesh is fundamentally an agriculture- oriented state. It stands as the largest producer of grains and vegetables in India. The state also holds the largest food distribution arrangement in India but here are significant differences between all four areas of Uttar Pradesh regarding consumption patterns and the state of food security. Only western urban area of Uttar Pradesh has shown a significant positive progress in the direction. Therefore, the people residing in this area are comparatively satisfied than people residing in other areas of Uttar Pradesh. For the overall development of the Uttar Pradesh and for making it a completely food secure state, it is necessary to develop an integrated, sustainable food system in Uttar Pradesh. It is a prerequisite for attaining food and nutrition security. Therefore, there is a great requirement to pay attention to its linkages with sustainable food system to achieve sustainability in food and nutrition security.
Affiliation
Neha Sikarwar, Research Scholar, Department of Economics, Dayalbagh Educational Institute (Deemed to be University), Dayalbagh, Agra 282005, Uttar Pradesh, Email: ns2u21@soton.ac.uk
Jyoti Gogia Professor, Department of Economics, Dayalbagh Educational Institute (Deemed to be University), Dayalbagh, Agra 282005, Uttar Pradesh, Email: JyotiGogia@dei.ac.in
References
Census (2011), Size, Growth Rate and Distribution of Population, Retrieved from the Census India, https://censusindia.gov.in/2011-prov-results/data_files/india/Final_PPT_2011_chapter3.pdf
FAO (Food and Agriculture Organization) (2000), The Four Dimensions of Food and Nutrition Security: Definitions and Concepts, Retrieved from The Food and Agriculture Organization: http://www.fao.org/elearning/course/FA/en/pdf/P-01RGConcept.pdf
Goli, S., A. Rammohan, and S.P. Reddy (2021), The Interaction of Household Agricultural Landholding and Caste on Food Security in Rural Uttar Pradesh, India, Food Security, 13(1):219-237.
Gupta, A. and D.K. Mishra (2018), Measuring Food Security through Dietary Diversity: Insights from a Field Survey in Rural Uttar Pradesh, India, The Indian Economic Journal, 66(3-4): 347- 364.
IFBN (India Food Banking Network) (2020), Hunger in India, Retrieved from https://www. indiafoodbanking.org/hunger
Sebby, K. (2010), The Green Revolution of the 1960s and Its Impact on Small Farmers in India, Retrieved from the University of Nebraska at Lincoln:https://digitalcommons.unl.edu/cgi/ viewcontent.cgi?article=1027&context=envstudthese
Tanksale, A. and J.K. Jha (2015), Implementing Nation Food Security Act in India: Issues and Challenges, British Food Journal, 117(4): 1315-1335.
UNICEF (United Nations International Children’s Emergency Fund) (2019), Nutrition, Retrieved from UNICEF: https://www.unicef.org/india/what-we-do/nutrition
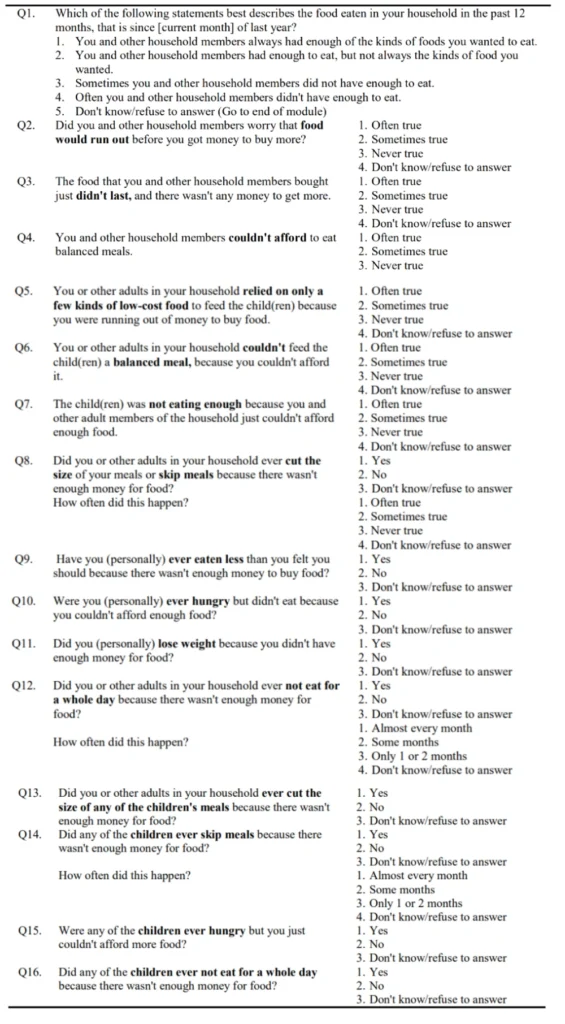
Annexure 1: Household Food Security Survey Module (HFSSM)
The HFSSM focuses on self-reports of uncertain, insufficient, or inadequate food access, availability, and utilization due to limited financial resources, and the compromised eating patterns and food consumption that may result.
The HFSSM is not designed to capture other possible reasons for compromised food consumption, such as voluntary dieting or fasting. The HFSSM is a household measure, that is, it assesses the food security situation of adults as a group and children as a group within a household but does not determine the food security status of each individual member residing in the household. It cannot be assumed that all members of a household share the same food security status.
The HFSSM contains 18 questions about the food security situation in the household over the previous 12 months. Each question specifies a lack of money or the ability to afford food as the reason for the condition or behaviour. The questions range in severity from worrying about running out of food, to children not eating for a whole day.
Annexure 2: Food Consumption Score
The Food Consumption Score (FCS) is an index that was developed by the World Food Programme (WFP) in 1996. The FCS aggregates household-level data on the diversity and frequency of food groups consumed over the previous seven days, which is then weighted according to the relative nutritional value of the consumed food groups. For instance, food groups containing nutritionally dense foods, such as animal products, are given greater weight than those containing less nutritionally dense foods, such as tubers. Based on this score, a household’s food consumption can be further classified into one of three categories: poor, borderline, or acceptable. The food consumption score is a proxy indicator of household caloric availability.
Method of Calculation
A brief questionnaire is used to ask respondents about the frequency of their household’s consumption of eight different food groups over the previous seven days. To calculate the FCS from these results, the consumption frequencies are summed and multiplied by the standardized food group weight (see the food groups and corresponding weights below). Households can then be further classified as having “poor,” “borderline,” or “acceptable” food consumption by applying the WFP’s recommended cut-offs to the food consumption score.
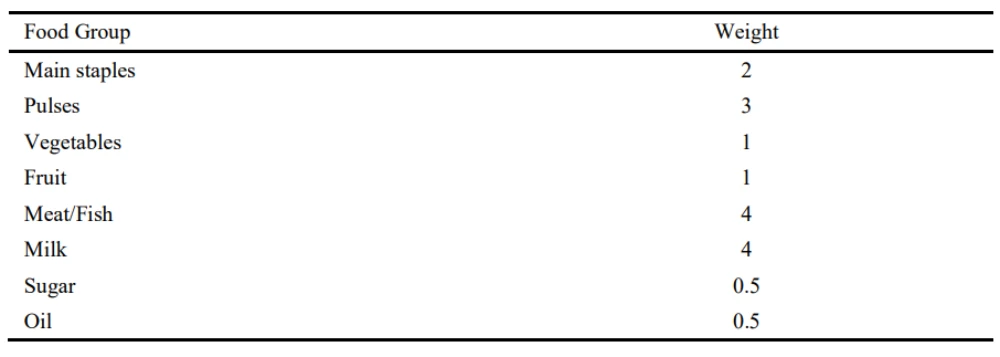
Steps:
1. Group food items in the specified food groups (condiments not included)
2. Sum all the consumption frequencies of food items within the same group
3. Multiply the value of each food group by its weight (see table)
4. Sum the weighted food group scores to obtain FCS
5. Determine the household’s food consumption status based on the following thresholds: 0-21: Poor; 21.5-35: Borderline; >35: Acceptable