Towards a Kuposhan Mukt Bharat: An Exploration of Nutrition Sensitive Budgeting in India
March 2024 | Tanusree Paul
Abstract
Nutrition is rapidly emerging as a quintessential development goal. Amidst much global advocacy, interest in nutrition in Indian policy-scape has also resurfaced. With the resolve to transform India into Kuposhan Mukt Bharat (malnutrition free India), a number of missions, programmes and schemes have been launched in the country with definite time-bound targets. This paper delves into analysing Union Budget allocated to nutrition sensitive sectors during
2014-2015 to 2020-2021. It observes a declining trend in most of the nutritionsensitive interventions. It concludes that more concerted efforts are needed in terms of increasing budgetary allocations for nutrition-sensitive interventions,
particularly sanitation, women’s empowerment, education, health and information-education-communication.
Key-words
Nutrition-sensitive, Nutrition, Budget, Malnutrition, Kuposhan,India.
I Introduction
Nutrition is an indispensable component of development and has begun to gain increasing attention in policy discourses within and across nations. The United Nations’ declaration of 2016-2025 as the UN Decade of Action on Nutrition has further fueled this momentum. According to the Global Nutrition Report 2018, among all the regions of the world, South Asia bears the highest burden of stunting with about 38.9 per cent of the worlds stunted under-5 children living here. India’s positioning vis-à-vis other countries in South Asia and even Africa is particularly deplorable. At the disaggregated level, two of the South Asian countries, India (46.6 million) and Pakistan (10.7 million) along with Nigeria (13.9 million) are home to almost half (47.2 per cent) of all stunted children in the world. On the other hand, India (25.5 million) is also one of the countries along with Nigeria (3.4 million) and Indonesia (3.3 million) which contribute to the highest share of wasted children under five years of age. Further, although overweight and obesity are typical problems of the upper-middle income countries, India and Pakistan are among the South Asian countries that are home to more than a million overweight children, the other countries being China, Indonesia, Egypt and Brazil. This indicates a dual burden of malnutrition in our country.
Although nutrition received some attention of the policy-makers in India since as early as 1960s and 1970s, specific interest on nutrition resurfaced in the Indian policy-scape around the early 2010s, with the then Finance Minister Sri Arun Jaitley announcing in his Budget Speech on July 10, 2014, that “[a] national programme in Mission Mode is urgently required to halt the deteriorating malnutrition situation in India, as present interventions are not adequate. A comprehensive strategy including detailed methodology, costing, timelines and monitorable targets will be put in place within six months” (Budget Speech 2014). Realising nutrition as a quintessential development goal, the Indian Government launched a plethora of missions, schemes and programmes to address malnutrition, which also reflect ardent intent on the part of the State. However, the extent to which India is committed to implement these interventions and address malnutrition is a question that is crucial and will be engaged with in this paper. As per the Hunger and Nutrition Commitment Index (HANCI) 2019, India ranked 25 out of 45 countries (2013 rank was 19 out of 45). That said, this paper would focus on nutrition-sensitive interventions. The specific questions that would be addressed in this paper are: first, which are the nutrition-sensitive interventions that have significant bearing upon indicators of child malnutrition in India; and second, how are these interventions prioritised in policy? The answer to the latter question would be sought for by closely looking at the budgetary outlays for the nutrition sensitive interventions. This paper is organised into five sections. This introductory section is followed by a section on survey of literature. The third section presents the data and methods used in this paper. The fourth section presents the data analysis which include two sub- sections- a) how nutrition-sensitive interventions correlate to indicators of child malnutrition such as stunting (height-for-age- Z-score is below minus two standard deviations from the median of the reference population ), wasting (Weight-for- height Z-score is below minus two standard deviations from the median of the reference population) and underweight (weight-for-age Z-score is below minus two standard deviations from the median of the reference population); (b) how the budgetary outlays in selected sectors that have implications for nutrition in an indirect manner have changed over the years. The fifth section puts forth the concluding remarks.
II Survey of Literature
A unique aspect of India’s nutrition governance is its excessive focus on two programmes: Mid-Day Meals and the Integrated Child Development Scheme (ICDS). While the former was introduced in 1962-1963 for the 6-11 years old children, the latter was introduced in 1975 for both 0-6 years aged children as well as pregnant and lactating mothers. In fact, the ICDS came to be considered as India’s answer to all malnutrition concerns since the Sixth Plan (1980-1985). Later on, India had its first National Nutrition Policy (NNP) in 1993 followed up by the National Plan of Action on Nutrition 1995. Since 1993, India did not have a second NNP for more than two decades; although a retinue of other policies and programmes were launched, that had implications for nutrition. India constituted its first National Nutrition Mission (NNM) in 2003, under the chairpersonship of the Prime Minister. Although some States subsequently constituted their respective State Missions1, the National Mission at the Centre did not function and was later repealed in 2008. However, there was a felt need for a focused National Nutrition Strategy (NNS), particularly because notwithstanding a remarkable rise economic growth rate and reduction in poverty, malnutrition continued to persist unrelentingly. Haddad (2011) appraises that strong governance mechanisms were required underscoring inter-sectoral coordination, prioritising investment in education and a strong leadership. Reddy (2011) also emphasised the need for multi-sectoral coordination and effective implementation of convergence in planning and implementation. Amidst these expectations, in July 2014, the then Finance Minister Sri Arun Jaitley announced in his Budget Speech the need for a focused national programme in mission mode, to address malnutrition in the country. Three years later, in 2017-2018, the National Nutrition Mission (NNM) was overhauled with a three-year budget of ₹9046.17 crore started from 2017- 2018 (pib.gov.in). The latest NNM targets comprehensive measures to address malnutrition. It will comprise mapping of various Schemes contributing towards addressing malnutrition, including a very robust convergence mechanism, Information Communication Technology (ICT) based Real Time Monitoring system, incentivizing States/UTs for meeting the targets, incentivizing Anganwadi Workers (AWWs) for using IT based tools, eliminating registers used by AWWs, introducing measurement of height of children at the Anganwadi Centres (AWCs), Social Audits, setting-up Nutrition Resource Centres, involving masses through Jan Andolan for their participation on nutrition through various activities, among others (NITI AYOG 2017).
Another major challenge in this context is micro-nutrient deficiency. Although required in small quantities, micronutrient deficiencies, “also referred to as ‘Hidden Hunger’, affects the health, learning ability as well as productivity owing to high rates of illness and disability contributing to vicious cycle of malnutrition, underdevelopment and poverty” (Gonmei and Toteja 2018: 511). “A multipronged approach is needed to address deficiencies of key vitamins and minerals, such as vitamin A, iron, iodine and zinc, that continue to coexist and interact with protein and energy deficits” (NITI Aayog, 2020). Gonmei and Toteja in their review have highlighted that deficiencies related to iron, vitamin A, iodine and zinc are critical public health concerns, especially among children and adolescents (Gonmei and Toteja 2012). Besides, folate, vitamin B12 and vitamin D are also significant in the context of maternal and child health. Anaemia is a major public health challenge in the country. Iodine deficiency disease (IDD) is another major hurdle although introduction of iodised salt has resulted in reducing the magnitude of the problem. Vitamin A deficiency causing blindness and Vitamin D deficiency causing rickets are other important clinical challenges. India has launched an entourage of programmes to address these micro-nutrient deficiency related challenges. In this context, mention must be made of National Nutritional Anaemia Control Programme (NACP); Food fortification which includes fortification with iron, iodine, folic acid, Vitamins A and D etc.; Dietary Diversification and increasing household access to micro-nutrient rich food; Enhanced Production to Consumption of Millets and Pulses; Monitoring, Surveillance and Management Information System for Early Detection; Nutrition Health and Education and so forth.
Notwithstanding the fact that India did have a retinue of interventions to address its malnutrition problem since the early 1960s, it continues to be one of the largest contributors to malnutrition in the world, ranking 107 out of 121 countries as per the 2022 Global Hunger Index.
As recognised by Ruel, et. al. (2013: 536), “acceleration of progress in nutrition will require effective, large- scale nutrition-sensitive programmes that address key underlying determinants of nutrition and enhance the coverage and effectiveness of nutrition-specific interventions.” Nutrition-sensitive programmes basically target the underlying determinants of nutrition such as poverty, food insecurity, access to resources etc. and are multi-sectoral in nature cutting across sectors like agriculture, education, health, water and sanitation, social protection and so forth (Ruel, et. al. 2013). That said, the focus of this paper is on nutrition sensitive indicators which have been variously mapped by several national and international agencies. It may be appropriate to mention here that, in the Indian context, although there is a generally accepted list of nutrition-specific interventions2, the same is not available for nutrition-sensitive interventions (Shrivastava and Singh 2017). Nevertheless, a plausible list of indirect interventions has been charted out based on an extensive review of literature. The conceptual frameworks on undernutrition by Ruel and Alderman (2013), UNICEF (2013) and Centre for Budget and Governance Accountability (CBGA) (2016) have also informed the selected interventions. By and large, four broad factors consistently emerge as crucial determinants of nutrition:
Firstly, the underlying causes which determine the potential resources having implications for nutrition. These underlying causes can further be divided into two sub-parts:
a) Access to adequate quantity and quality of resources : Adequate access to resources, not only of the household but also of the women, is one of the important indirect determinants of nutrition. In terms of household’s access to resources, a key indicator is its economic status, measured through income, expenditure or assets. For the present study, following variables have been taken from the NFHS:
i. Percentage of Households in Lowest Wealth Quintile
It is worth noting that although increased income has lead to increased expenditure on food and nutrition-rich diets (Arimond and Ruel 2006), expenditure on non-food expenditures such as health, sanitation, electricity, water, housing, etc., that have implications for nutrition (Headey 2013); yet others have argued that income does not have a unidirectional linear positive effect on nutrition.
Another major factor that influences women’s access to resources is women’s education. Behrman and Wolfe (1984) observe that secondary and tertiary level education yields better outcomes so far as children’s nutrition is concerned. The variable selected in this category is:
ii. Percentage of Women Aged 15-49 Years with 10 or More Years of Completed Schooling
A third factor strongly influencing women’s access to resources is women’s employment, although there seems to be some lack of consensus among scholars regarding women’s work in agriculture and its impact on nutrition (See Kadiyala, et. al. 2014, Johnston, et. al. 2018).3 Besides, not only employment but working for cash earning is an important factor that influences nutrition outcomes. The variable selected here is:
iii. Percentage of 15-49 Currently Married Women Who Were Employed and Earning Cash
iv. Percentage of Women Age 15-49 Who Have Access to Money that They Can Decide How to Use
Women’s access to and control over technology is another important indirect determinant of nutrition. In fact, a number of studies note that access to mobile phones expand livelihood opportunities, social contacts, as well as enhances access to health-related information and healthcare (Chib, et. al. 2012, Laura 2010, Tenhunen 2008). That said, the variable selected in this context is:
v. Percentage of 15-49 Women Having a Mobile Phone that They Themselves Use
b) Socio-cultural environment : This dimension helps understand the context in terms of its social and cultural aspects. Women’s status is an important signifier of the cultural disposition of any society/community. In fact, literature abounds in studies that try to connect women’s empowerment with positive nutrition outcomes. Women’s status in general has been cited as an important factor by Bhagowalia, et. al. (2012), particularly those pertaining to mobility, decision- making power, and attitudes toward verbal and physical abuse. Malapit, et. al. (2013) note that women’s empowerment influences quality of infant and young child feeding practices. Empowerment here has been conceptualised not as mere outcome of education and income but as a function of ability to take decisions and not having to experience violence. Further demographic variables such as age at marriage, child bearing, birth order, etc., also signify women’s position in the society. Lower the age at marriage, lower the age at first child bearing, higher the birth order, higher is the prevalence of health risks and lower is their over-all well- being. In order to map the socio-cultural dimension as the underlying cause to malnutrition, the following variables have been used:
a. Women aged 20-24 years married before age 18 years.
b. Percentage of women aged 15-19 who have begun child bearing (have had a live birth or are pregnant with first child)
c. Percentage of ever-married women age 15-49 who have ever experienced emotional, physical, or sexual violence committed by their husband
d. Percentage of women aged 15-49 who have freedom of mobility (allowed to go to the market, health facility, and places outside the village/community)
e. Percentage of women who usually make decisions alone or jointly with their husband about own health care
f. Percentage of women aged 15-49 who own land
Secondly, immediate causes which include
a) Health scenario– There are several dimensions to health. Since mother’s health and nutrition are of paramount significance for child’s nutrition, access to prenatal, pre-natal and post-natal care have been observed to be significant in several studies (Headey 2013). Hence, for the purpose of this paper, following variables have been selected:
a. Percentage of mothers who received financial assistance under JSY for births delivered in an institution.
b. Percentage of 15-49 who had four or more ANC visits.
c. Institutional deliveries.
d. Percentage of women age 15-49 who had any contact with a health worker such auxiliary nurse midwife (ANM), lady health visitor (LHV), AWW, Accredited Social Health Activist (ASHA), multipurpose worker (MPW), or other community health worker.
e. Percentage of children who received postnatal care from a skilled provider in the first two days of birth.
f. Percentage of children age 12-23 months who received all basic vaccines (BCG, measles, and three doses each of DPT and polio vaccine (excluding polio vaccine given at birth).
b) Water Sanitation Hygiene (WASH): Access to safe drinking-water, sanitation and hygiene (WASH) services is an essential element for healthy living. Several studies have highlighted positive impact of WASH on nutrition, particularly prevention of stunting (Alzua, et. al. 2015, Fink, Gunther and Hill, 2011, Spears, Ghosh and Cumming 2013). A WHO report (2015) in collaboration
with UNICEF and USAID articulates the need for integrating WASH concerns with nutrition interventions including important monitoring and evaluation (M&E) aspects. Given the importance of WASH in the context of nutrition, following variables have been selected:
a. Percentage of households with improved source of drinking water
b. Percentage of households with toilet facilities
c. Percentage of mothers with children whose stools were disposed off safely
d. Percentage of women 15-24 who use hygienic methods of protection during menstruation
Thirdly, Information Education Communication (IEC): IEC is not really a cause which can effect nutrition indirectly, however it has the potential to catalyse behavioural change in favour of nutrition. Many of the basic causes allude to socio- cultural dimensions, ranging from constraints on women’s access to resources to experience of violence to restraints on women’s decision-making on matters pertaining to their own lives. It is not possible to address these socio-cultural bottlenecks that each of these variables pose for women without engaging with the attitude, perception and behaviour of the community.
a. Percentage of fathers who said that at some time during the pregnancy, a health provider or worker spoke to them about family planning or delaying the next child
b. Percentage of fathers (whose youngest living child age 0-35 months was not delivered in a health facility) who said that during the pregnancy, someone explained to them the importance of breastfeeding the baby immediately after birth
c. Percentage of children under 6 years of age whose mothers received counselling from an AWC after the child was weighed
d. Among the children under six years of age, percentage whose mothers received health and nutrition education from AWCs during pregnancy
e. Among the children under six years of age, percentage whose mothers received health and nutrition education from AWCs while breastfeeding
The preceding discussion identifies the nutrition-sensitive indicators based on an extensive survey of literature. In the following section, these indicators would be correlated with the different indicators of malnutrition- stunting, wasting and underweight in order to understand which underlying factors have stronger association with malnutrition and thus require focussed policy interventions. Thereafter, this paper looks into the budgetary allocations in these priority sectors. Indeed, sustainable funding is one of the most important components behind assessing India’s commitment to nutrition governance (Kaia Engesveen, et. al. 2009, WHO, 2007, 2012; IDS 2012; Pelletier, et. al. 2012).
III Data and Methods
This paper primarily draws from two data sources: National Family Health Survey (NFHS) 2015-2016 and data from Union Budget official website. A major problem encountered while analysing the sectoral domains is that of temporal comparison due to periodic changes in the categorisation of the budget line items by the Ministries. Nonetheless, every effort has been made to keep the items comparable across time, in the following thematic sectors: Agriculture and allied activities, Health, Education, Water Sanitation and Hygiene (WASH), Livelihood and Employment, Women and Child Development. The budget data have been supplemented by information from other published reports as well as the Parliamentary questions, both starred and un-starred, budget speeches, etc.
IV Data Analysis
Nutrition-Sensitive Interventions: Setting Priorities
It needs to be clarified here that the indicators have been selected, subject to availability from the National Family Health Survey 2015-2016. Each of these variables has been correlated with the three indicators of child malnutrition: stunting wasting, underweight. The correlation coefficients are presented in Table 1.
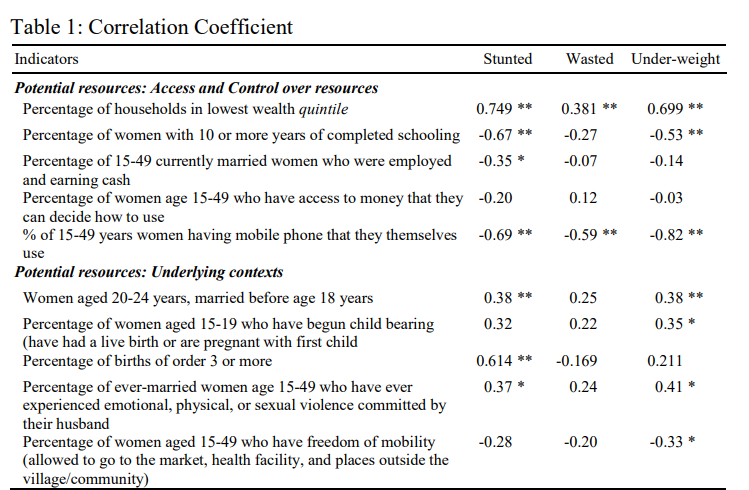
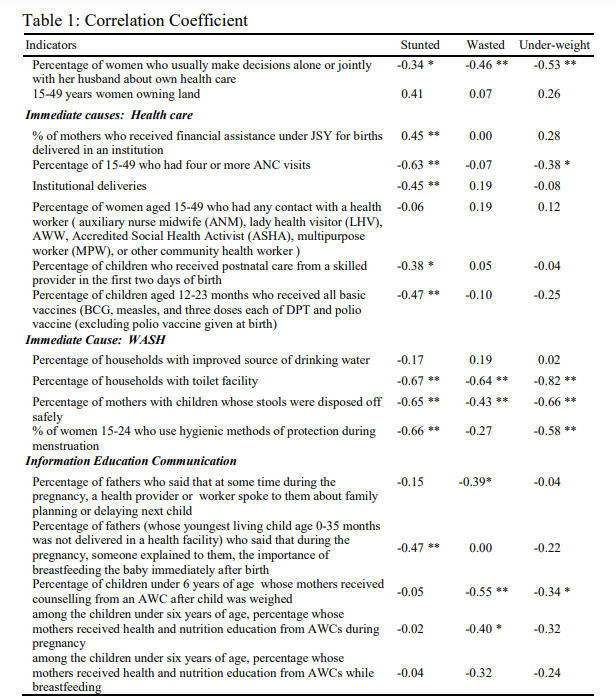
Notes: N=36; * Correlation is significant at the 0.05 level (2-tailed); ** Correlation is significant at the 0.01 level (2-tailed). Source: Author’s calculations from NFHS 4.
It is evident that among the underlying contextual factors, ability to take decisions about own health jointly with their husbands is significantly correlated with all the three malnutrition indicators. Besides, early marriage and experience of violence is also significantly correlated with stunting and underweight.
Education and employment with cash earnings among women are important influencing factors so far as malnutrition is concerned. The present analysis observes that among the factors signifying access to or control over resources, percentage of women with 10 or more years of completed education is more important than employment with wage earnings since the former is significantly correlated with two of the three malnutrition indicators. Another point worth noting is that percentage of women who own mobiles and themselves use the device is a very important factor as it is significantly correlated with all the three malnutrition indicators.
Among the health-care related indicators, assistance received under JSY, four or more antenatal visits, children receiving postnatal care from skilled birth provider within two days after birth, institutional deliveries and immunisation are significantly correlated with stunting. However, these factors do not have much effect on wasting as is indicated by the lack of significant correlation coefficients. Sanitation seems to be an extremely important component in addressing malnutrition. Particularly, safe disposal of children’s stools and having toilet facilities in the household seem to be most effective as is indicated by significant correlations of these variables with all the three indicators of malnutrition. Information Education Communication (IEC) is another important indirect intervention for nutrition. As indicated in Table 1, counselling and nutrition education provided by the Anganwadi Workers are significantly correlated with wasting and underweight.
Financing Nutrition, Prioritising Actions
The preceding discussion clearly helps identify those factors which indirectly influence nutrition at the macro level. With these identified indicators, let us now understand how these are prioritised in public policies. An effective way to do so is to engage with the patterns of government spending on these interventions. This section delves into understanding the budgetary outlays by the Government of India. To start with, and in keeping with the discussion in the previous section, about seven sectors that are likely to influence nutrition outcomes have been identified: (a) Agriculture and allied; (b) Health; (c) Employment and Livelihood; (d) Education; (e) WASH; (f) Women and Child Development and (g) Information Education Communication (IEC). Each of these sectors is spread across different ministries/departments which have been mapped at the second level. Although it is extremely difficult to pin down every scheme within each sector influencing nutrition, an attempt has been made to identify the important schemes, both centrally sponsored and central-sector schemes, based on secondary literature, policy brief documents, such as those of the CBGA. The budget outlays for all these nutrition sensitive interventions are then analysed for the Union Budgets during 2014-2015 to 2020-2021 (henceforth referred to as the studied time period).
Agriculture, Livestock and Fishery
Several studies observe that there is a very strong interconnectedness between agriculture and nutrition outcomes (Pandey, et. al. 2016). The then Finance Minister Sri Arun Jaitley in his Budget Speech in 2014-2015 observed that “we are committed to sustaining a growth of four per cent in Agriculture and for this we will bring technology driven second green revolution with focus on higher productivity and include “Protein revolution” as an area of major focus. We would begin our analysis by looking into this sector.” The agriculture and allied sector (livestock and fishery) is spread across several ministries, namely Ministry of Agriculture and Farmers’ Welfare, Ministry of Consumer Affairs, Food and Public Distribution, Fishery, Animal Husbandry and Dairying and Jal Shakti Ministry (Department of Water Resources, River Development and Ganga Rejuvenation).
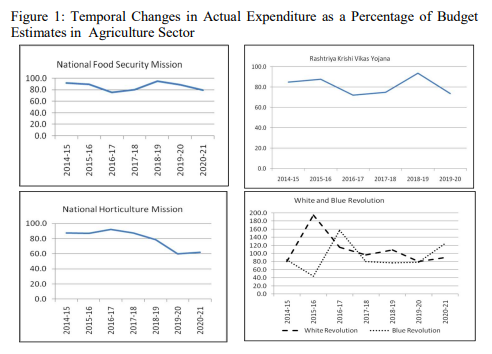
While the total budget allocation for the Ministry of Agriculture and Farmers’ welfare saw a phenomenal increase from ₹19,255.1 crore in 2014-2015 to ₹1,34,399.77 crore in 2020-2021, allocations for the National Food Security Mission declined form 9.73 per cent to 1.56 per cent of the total ministry budget during the same period. Similar is the case with the Rashtriya Krishi Vikas Yojana which declined from about 44 per cent in 2014-2015 to about three per cent of the total allocations of the Ministry. Budget allocations for the White Revolution increased while that of the Blue Revolution fluctuated during the study period. No allocation for the National Mission for Oilseeds and Oil Palms have been reported for 2019-2020 and 2020-2021. Budget outlays for National Horticulture Mission also declined from 10 per cent to about two per cent during the studied time period.
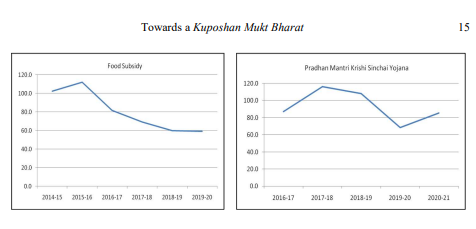
Pradhan Mantri Krishi Sinchai Yojana is an important programme that aims to improve irrigation, providing water to the field of every farmer, improving water use efficiency to provide ‘Per Drop More Crop’. Fortunately, this Yojana run by the Department of Water Resources, River Development and Ganga Rejuvenation under the Jal Shakti Ministry experienced an increase in budget outlay during the studied time period.
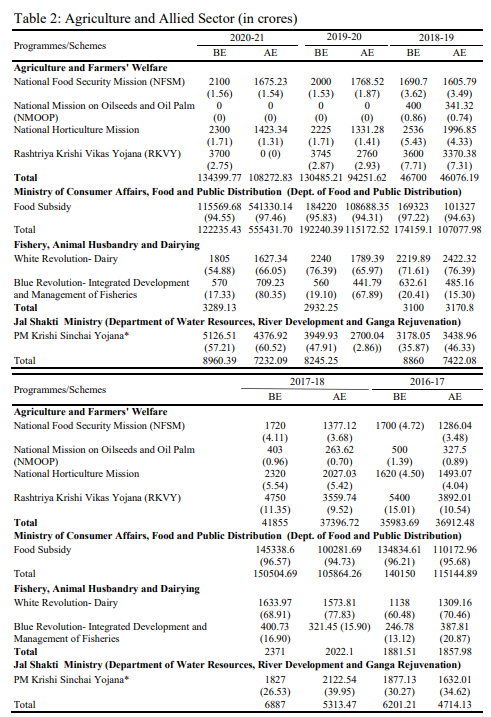
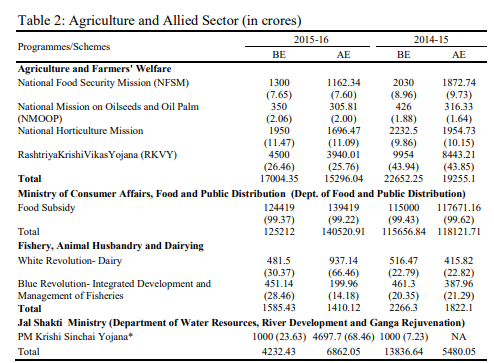
Notes: Figures in parentheses indicate percentages; NA- Not available in the Budget Documents; *PM Krishi Sinchai Yojana was placed under Department of Agriculture, Cooperation and Farmers’ Welfare for the 2019- 20 (AE) data. Source: Author’s calculations based on Union Budget of India data.
The Public Distribution System is one of the cornerstones of India’s drive to attain food security. It aims at distributing food and non-food items at subsidised rates to the poor. One of the oldest interventions in India, the Government had been implementing reforms from time to time to scale up the system. The budget allocations for the Department of Food and Public Distribution under the Ministry of Consumer Affairs, Food and Public Distribution increased from 118121.71 crores to 122235.43 crores, a meagre increase by 3.48 per cent. However, allocations for food subsidies declined by about 1.8 per cent, from 117671.16crores to 115569.68 crores.
Another point worth mentioning here is that the gap between Budget Estimates (BE) and Actual Expenditure (AE) has increased over the years. While during 2014-2015, about 98 per cent of the BE for Food Subsidies was actually spent, during 2019-2020, only about 59 per cent was spent. In case of Blue Revolution and Pradhan Mantri Krishi Sinchai Yojana, the percentage of AE to BE experienced an increase during 2019-1920 to 2020-2021. All the other programmes in this sector experienced a decline.
Education
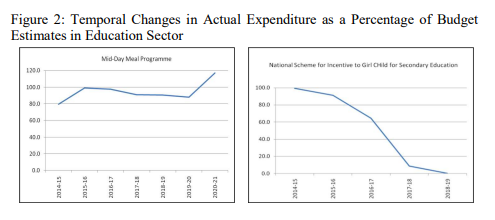
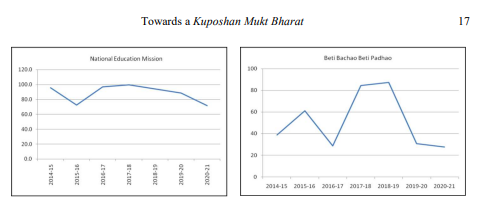
The correlation coefficients discussed in the previous section indicate that women’s education, especially secondary education holds significant correlation with children malnutrition. For the budget analysis, programmes/schemes in the education sector have been selected from two ministries- Ministry of Human Resource Development (MHRD) and Ministry of Women and Child Development (MWCD). It is observed that outlays for the Mid-Day Meal scheme, one of the flagship programmes for catering to nutrition needs of the country, have been decreasing throughout the studied time period. It was 23 per cent during 2014- 2015 and came down to around 18 per cent during 2020-2021. The budget estimates for the National Education Mission, a Centrally Sponsored Scheme that includes Samagra Shiksha Abhiyan, Sarva Shiksha Abhiyan, Rashtrita Madhyamik Shiksha Abhiyan and Adult education, have also decreased drastically from about 87 per cent during 2014-2015 to 65 per cent during 2020-2021. This is despite the Finance Minister’s declaration during his budget speech of 2015-2016 that the Government, after universalisation of primary education would focus on quality of education
of 2015-2016 that the Government, after universalisation of primary education would focus on quality of education. The BE for National Scheme for Incentive to Girl Child for Secondary Education, a Central-Sector Scheme, decreased between 2017-2018 and 2020-2021, from about 0.7 per cent to 0.2 per cent of total ministry budget. The budget outlay for Beti Bachao Beti Padhao, a Centrally Sponsored Scheme to save and educate the girl child under MWCD, increased from 2014- 2015 to 2018-2019, and decreased slightly in 2020-2021.
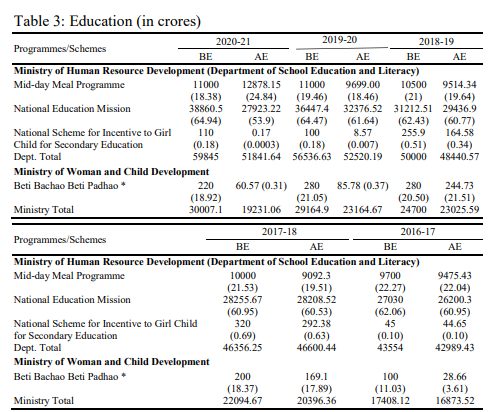
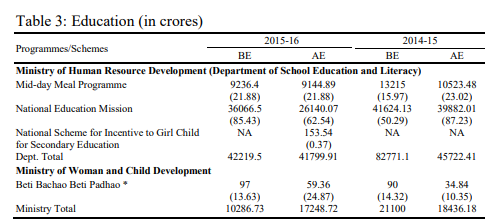
Notes: *Percentage for Beti Bachao Beti Padhao is calculated out of total allocations for Mission for Empowerment of Women till 2016-2017, percentages for2015-16 BE and 2014-15 BE and AE are calculated out of total allocations for Children welfare schemes under MWCD; Figures in parentheses indicate percentages; NA- Data not reported in the budget tables. Source: Author’s calculations based on Union Budget of India data.
It is worth noting that with respect to Mid-Day Meal Programme, the percentage of AE to BE increased significantly over time, exceeding 100 per cent in 2020-2021. Despite the importance of secondary education, it is alarming that there has been a remarkable drop in the AE as a percentage of BE with respect to National Scheme for Incentive to Girl Child for Secondary Education from 99.2 in 2016-2017 to 0.2 in 2020-2021. Further, in the context of Beti Bachao Beti Padhao, the per cent of AE incurred out of BE is remarkably low (only 27 per cent in 2020-2021).
Employment and Livehood
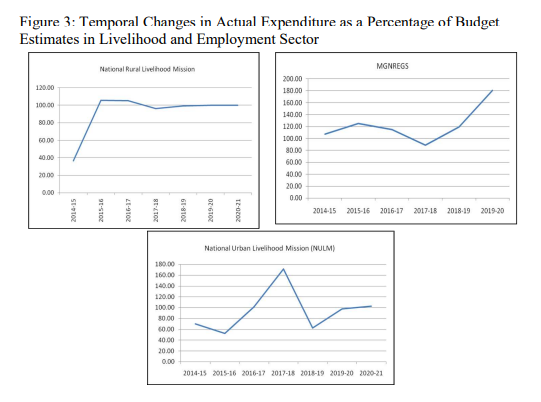
Livelihood and employment are important because these contribute to expansion of income-generating opportunities leading to an increase in expenditure on food and nutrition-dense diet. So far as rural employment is considered, two schemes have been selected from the Ministry of Rural Development and one from the Ministry of Housing and Urban Affairs. The National Rural Livelihood Mission (NRLM) is an extremely important Centrally Sponsored Scheme, which aims to eliminate rural poverty through sustainable livelihood options. The Government has expressed, time and again, its resolve to provide maximum livelihood opportunities in rural India. For the NRLM, not only have the budget outlays as a percentage to total Ministry outlays increased in all the selected schemes/programmes, but the gap between the BE and AE has also decreased. While in 2014-2015, only about 37 per cent of the total BE was spent, in 2018- 2019, the AE exceeded BE. Although NRLM constitutes less than 10 per cent of the ministry’s total BE, there has been a 60 per cent increase in BE between 2017- 2018 and 2020-2021 (see Table 4). The Finance Minister Sri Arun Jaitley in his budget speech of 2018-2019 announced that “in the year 2018-2019, for creation of livelihood and infrastructure in rural areas, total amount to be spent by the Ministries will be ₹14.34 lakh crore, including extra-budgetary and non-budgetary resources of ₹11.98 lakh crore. Apart from employment due to farming activities and self-employment, this expenditure will create employment of 321 crore person days, 3.17 lakh kilometres of rural roads, 51 lakh new rural houses, 1.88 crore toilets, and provide 1.75 crore new household electric connections, besides boosting agricultural growth.”
The other major scheme is Mahatma Gandhi National Rural Employment Guarantee Scheme (MGNREGS), budget allocation for which increased only marginally, from about 50 per cent of total ministry outlays during 2014-2015 to about 51 per cent during 2020-2021. In this scheme, the AE exceeds the BE for all the financial years selected for this study, which indicates higher spending vis-à- vis estimated allocations. It is much disheartening to note that the allocation for the National Urban Livelihood Mission declined from about 26 per cent of total estimates in 2014-2015 to around two per cent of total estimates in 2020-2021. In this case also, the AE is much greater than the BE for all the years. Further, except 2019-2020, the estimated budget seems to be lesser than the actual expenditure of the previous years (see Table 4).
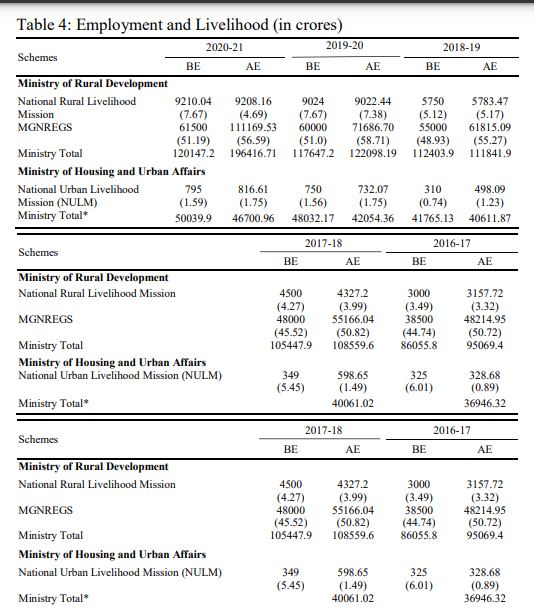
Notes: * 2017-2018 onwards, the percentages of NULM are calculated as percentage to total allocations to Housing and Urban Poverty Alleviation; Figures in parentheses indicate percentages; NA- Not available in the Budget Documents. Source: Author’s calculations based on Union Budget of India data.
It is important to note that the percentage of AE incurred out of BE is appreciably high for all the programmes in this sector. In case of MGNREGS, the AE exceeded BE for all the years considered. For NULM, the percentage of AE with respect to BE has been consistently high and exceeded BE in 2020-2021.
WASH
The importance of WASH on nutrition outcomes have already been discussed in the preceding section. For the budget analysis, following interventions have been selected: the National Water Mission (NWM), a Central Sector Scheme under the Department of Water Resources, River Development and Ganga Rejuvenation of the Jal Shakti Ministry; the National Rural Drinking Water Mission (NRDWM), also known as the Jal Jeevan Mission (JJM) and Swachh Bharat Mission-Gramin (SBM-G) under the Department of Drinking Water and Sanitation, Jal Shakti Minsitry; and the Swachh Bharat Mission –Urban (SBM-U) under the Ministry of Housing and Urban Affairs.
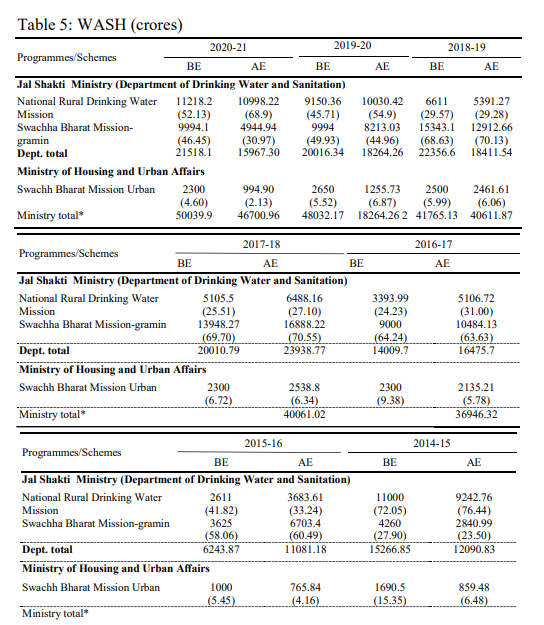
Notes: 2017-18 BE onwards -Percentage of SBM is calculated to total of Urban Development Ministry; Figures in parentheses indicate percentages; NA- Not available in the Budget Documents Source: Author’s calculations based on Union Budget of India data.
The NWM experienced a slight increase in BE from 0.02 per cent in 2014- 2015 to around 0.7 per cent in 2020-2021. However, it worth noting that amount utilised is remarkably lesser than the estimated budget outlays for all the FYs preceding 2018-2019. Under the Department of Drinking Water and Sanitation, both the selected programmes, viz., NRDWM and SBM-G (see Table 5) experienced fluctuations.
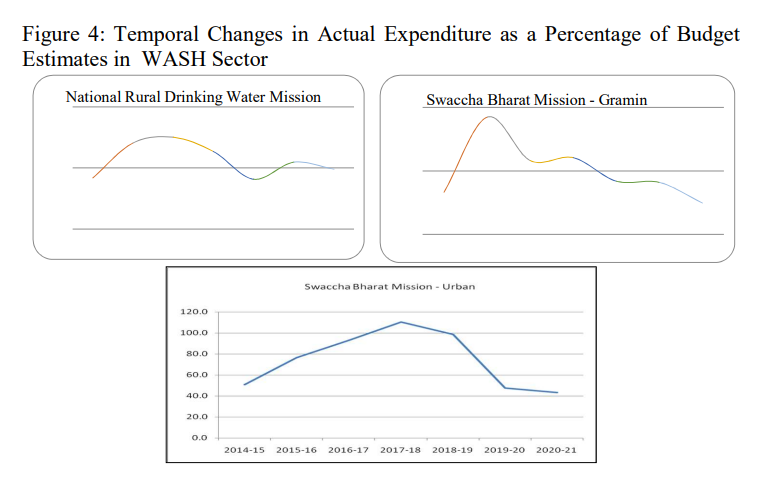
Much expectation is laid upon the Jal Jeevan Mission (JJM) which was launched in 2019 subsuming the erstwhile National Rural Drinking Water Mission. In her Budget Speech during 2019-20, the the Finance Minister Smt. Nirmala Sitharaman observed that “[e]nsuring India’s water security and providing access to safe and adequate drinking water to all Indians is a priority of the Government. ….This new Mantralaya (the Jal Shakti Ministry) will look at the management of our water resources and water supply in an integrated and holistic manner, and will work with States to ensure Har Ghar Jal (piped water supply) to all rural households by 2024 under the Jal Jeevan Mission. This Mission, under the Department of Drinking Water and Sanitation, will focus on integrated demand and supply side management of water at the local level, including creation of local infrastructure for source sustainability like rainwater harvesting, groundwater recharge and management of household wastewater for reuse in agriculture.” Notwithstanding such emphasis being placed upon JJM, the BE declined from 72 per cent in 2014-2015 to 24 per cent in 2016-2017 and has been increasing since then. In 2020-2021, it was 52 per cent of the total allocations of the Department. Except 2018-2019, almost all the FYs experienced higher spending vis-à-vis allocations (i.e. higher AEs compared to BEs).
Swachh Bharat Mission is a flagship Centrally Sponsored Scheme of the BJP- Lead Union Government. In 2019-2020, a budgetary allocation of ₹10,000.66 Crore has been made and as on 06.03.2020, an amount of ₹9,542.89 Crore has been released to the States/ UTs (Lok Sabha Unstarred question no. 4354, 2020). In her budget speech in 2019-2020 Union Budget, the Finance Minister Smt. Nirmala Sitharaman declared “We must not only sustain the behavioural change seen in people but also harness the latest technologies available to transform waste into energy. I now propose to expand the Swachh Bharat Mission to undertake sustainable solid waste management in every village.” However, Budgetary outlays for SBM-G too exhibit considerable fluctuations. It increased from 23.5 in 2014-15 to about 7- per cent during 2017-2018 but came down to 46 per cent in 2020-2021. During 2015-2016 and 2017-2018, the AEs exceeded BEs while during 2018-2019 and 2019-2020, the AEs were slightly above 80 per cent of the BEs, indicating a declining utilisation of funds. The Swachh Bharat Mission– Urban (SBM-U) experienced progressive decline in Budget outlays since 2014- 2015, from 15 per cent to about five per cent in 2020-2021. It has already been noted that sanitation is very strongly related to nutrition outcomes. In the context of declining allocations for Swachh Bharat mission, it would not be inappropriate to be apprehensive about the malnutrition condition in the country. The AE as percentage of BE remained only less than 50 per cent, which is indeed a matter of concern.
Health
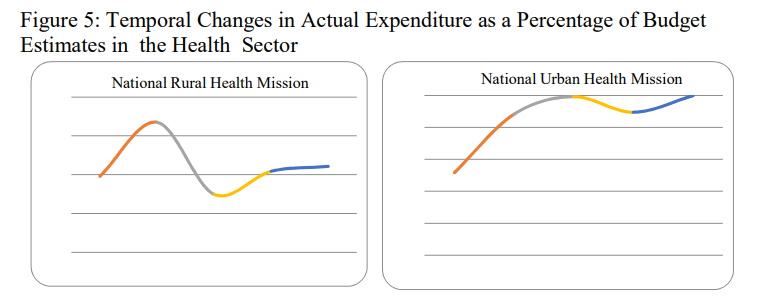
BE for 2014-2015 and 2015-2016 and AE for 2014-2015 pertain to National Health Mission. It is clear from Table 6 that BE for National Rural Health Mission (NRHM) far exceeds BE for National Urban Health Mission (NUHM) and the BE for both the Missions, as percentage to total allocations for the Ministry of Health and Family Welfare (MHFW) have declined consistently since 2016-2017. Same is true for the NUHM. Given that NRHM encompasses RCH Flexible Pool including Routine Immunization Programme, Pulse Polio Immunization Programme, National Iodine Deficiency Disorders Control Programme etc. and that immunization has been observed to be significantly correlated with child undernutrition; this decline in BE is alarming indeed. The Finance Minister in 2018-2019 declared the Government estimated schematic budgetary expenditure on health, education and social protection to be 1.38 lakh crore against estimated expenditure of ₹1.22 lakh crore in BE 2017-2018 (see Table 6).
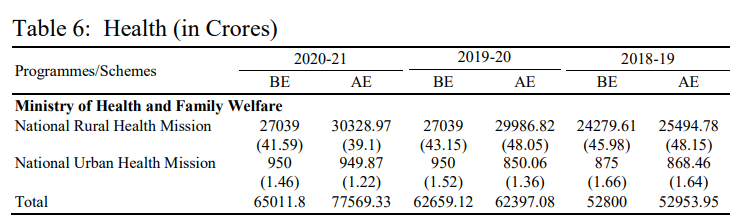
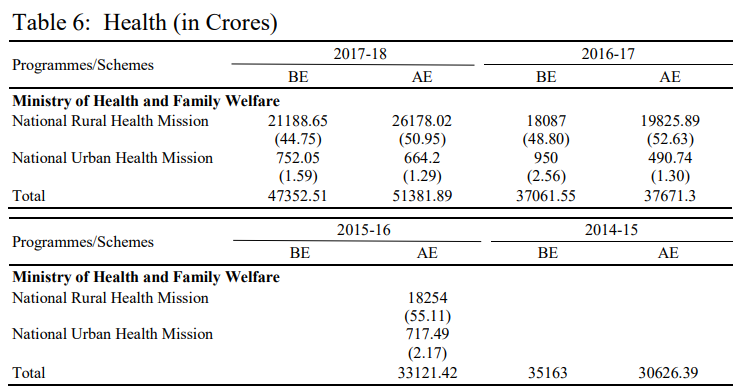
Notes: $ Figures indicate BE and AE for National Health Mission; Figures in parentheses indicate percentages; NA- Not available in the Budget Documents. Source: Author’s calculations based on Union Budget of India data.
It is worth noting that AE as percentage of BE with respect to NUHM has increased progressively since 2016-2017. In case of NRHM, the AE has continued to exceed BE consistently across all the years.
Women and Child Developement
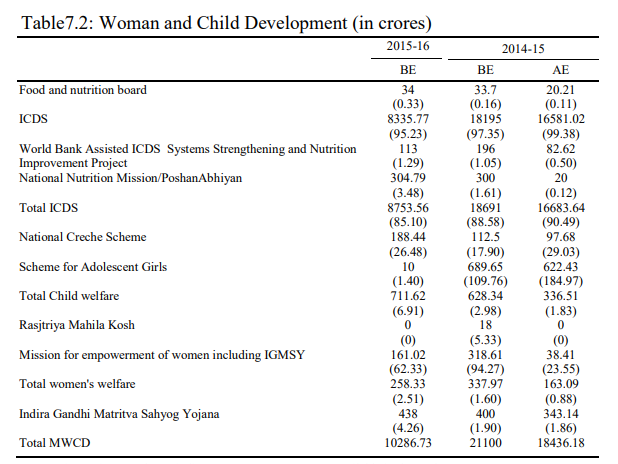
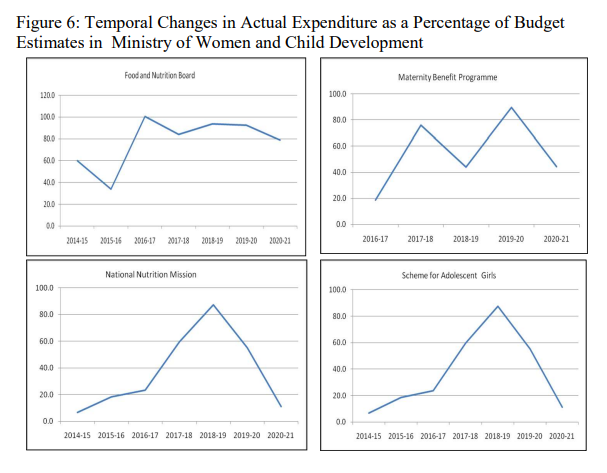
Data for the MWCD is presented in two tables since the schemes/programmes underwent major reorganisations within the Ministry during the studied time period. Food and Nutrition Board is a technical support wing under Child Development Bureau of the MWCD. Functions of the Board include providing inputs for policy issues in nutrition, nutrition education and extension programmes, training programmes etc. BE for the Board declined from 33.7 crores in 2014-2015 to 15.32 crores in 2020-2021. Integrated Child Development
Services (ICDS) is one of the mainstays of nutrition interventions in the country. The Poshan Abhiyan or the National Nutrition Mission is a flagship programme of the Bhartiya Janata Party-led Government of India. It is heartening to note that BE for the Mission increased from 1.61 per cent of the total allocations for umbrella ICDS in 2014-2015 to 12.96 per cent in 2020-2021. The gap between BE and actual expenditure has also decreased. Actual expenditure was 6.7 per cent of BE in 2014-2015 and increased to 87.41 per cent of BE in 2017-2018. The Revised estimate for the years 2019-2020 was equal to the BE for the year. Although ICDS is the key propeller of nutrition interventions in India, the outlays on supplementary nutrition under the ICDS experienced considerable decline from 86 per cent of total umbrella ICDS in 2017-2018 to 71 per cent in 2020-2021.
Since 2016-2017, the National Creche Scheme, Scheme for Adolescent Girls and Pradhan Mantri Matru VandanaYojana (PMMVY) were placed under Umbrella ICDS. During 2014-2015 and 2015-2016, the former two were placed under ‘Child Welfare’. The Indira Gandhi Matritva Sahyog Yojana (IGMSY) was relaunched as Pradhan Mantri Matru VandanaYojana (PMMVY) in 2017, the latter being implemented through the ICDS platform. The primary aim of the PMMVY is to provide partial wage compensation to pregnant and lactating
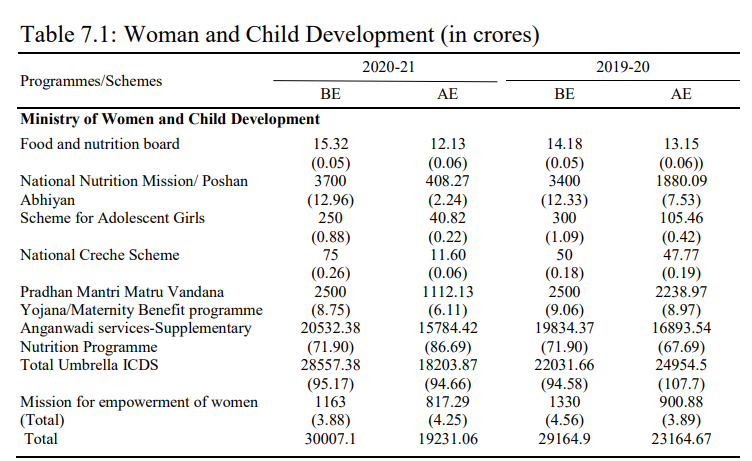
Notes: Figures in parentheses indicate percentages; NA- Not available in the Budget Documents. Source: Author’s calculations based on Union Budget of India data.
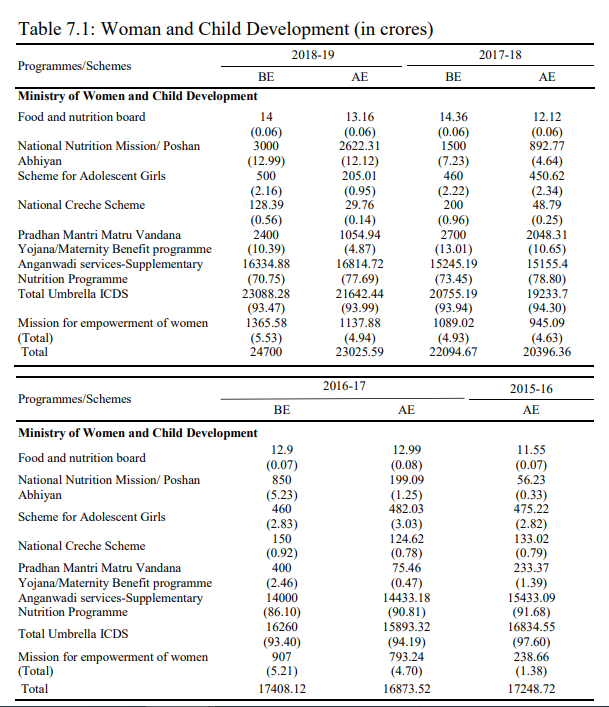
women of 19 years of age or above for the wage loss due to child birth and child care, as well as to facilitate conditions for safe delivery, feeding practices and good nutrition outcomes. It can be observed from the table that the year 2017 saw major scaling up of the BE on PMMVY compared to what it was for the IGMSY prior to 2017. The actual expenditure declined from 75.86 per cent of BE in 2017-2018 to 43.95 per cent of BE in 2018-2019. Empirical studies observe that women’s participation in wage work tend to yield negative results for child’s nutrition because these children are deprived of mothers’ milk. Thus, crèche facilities in the workplace have important consequences for the child’s nutrition. That said, if we look at the allocations of the National Creche Scheme, it may be noted that BE declined from 0.92 per cent of total umbrella ICDS in 2016-2017 to 0.26 per cent in 2020-2021.
Importance of addressing malnutrition among adolescents have been pushed into the centre stage of Indian policy discourses with the thrust being laid by the Poshan Abhiyan on addressing nutrition throughout the lifecycle. It is believed that addressing malnutrition at early stages in the lifecycle contributes towards arriving at long-term solutions to the problem. The Scheme for Adolescent Girls (earlier named as Rajiv Gandhi Scheme for Empowerment of Adolescent Girls), a Centrally Sponsored Scheme aims to improve the nutrition and health status of out of school adolescent girls of age 11-14 years and to motivate these girls to go back to formal schooling or skill training. The scheme has both nutrition and non- nutrition components, that latter include motivating out of school adolescent girls to go back to formal schools, IFA supplementation, Health check-up and Referral services, Nutrition and Health Education, Life Skill Education and counselling/guidance on accessing public services.
Notes: Figures in parentheses indicate percentages; NA- Not available in the Budget Documents. Source: Author’s calculations based on Union Budget of India data.
Despite such policy focus, we note a decline in the BE on the Scheme for Adolescent Girls, whereby it dropped from 2.83 per cent of umbrella ICDS in 2016-2017 to 0.88 per cent in 2020-2021. Besides, the gap between BE and actual expenditure also increased. While the actual expenditure was 98 per cent of the BE in 2017-2018, it came down to 41 per cent of BE in 2018-2019. The RE for 2019-2020 was 50 per cent of the BE. This clearly indicates a diminishing importance of the scheme in terms of budget allocations.
The relationship between women’s empowerment and nutrition has already been spelt out in this paper. That said, the Mission for Empowerment of women under the MWCD could play significant role in this context. It subsumes important schemes such as Mahila Shakti Kendra, Swadhar Greh, Ujjwala, Beti Bachao Beti Padhao, among others. This mission experienced an increase in BE, from 1.51 per cent of total MWCD to 3.88 per cent in 2020-2021. The utilisation of budget has also improved, with about 87 per cent of the BE being utilised in 2016-2017 which went up to 83 per cent in 2018-2019. The Rasjtriya Mahila Kosh (RMK) was set up in 1993 by the Government of India under MWCD to expand livelihood and employment opportunities, credit access, asset creation and so forth among women. Unfortunately, most of the years did not receive any allocation for the RMK. Thus under the MWCD, only the National Mission for Empowerment of Women experienced increase in BE over the years.

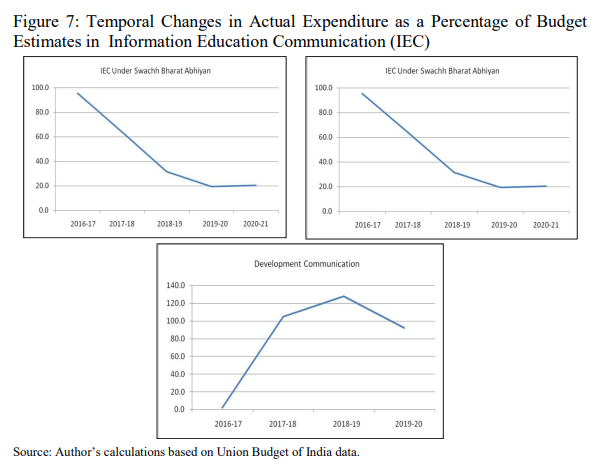
Information Education Communication (IEC)
The Finance Minister in his budget speech of 2014-2015 observed that “Government would focus on campaigns to sensitize people of this country towards the concerns of the girl child and women”. Behaviour change is a crucial driver for successfully delivering sanitation in the community, such as preventing open defecation, maintaining basic hygiene and so forth. Several studies, in fact, note that many members of the rural population in India continue to practice open defecation despite availability of toilets within their household premises, due to several cultural taboos. These studies call for concerted efforts targeting these attitudinal biases and effecting behaviour change among the people regarding use of toilets (Coffey, et. al. 2014, R Ramesh and P Sivaram 2015). It is therefore evident that communication for development that entails behavioural change through various IEC services is of paramount importance. In the previous section too, we noted that counselling of both mothers and fathers and nutrition education are significantly correlated with childhood malnutrition. That said, it would be interesting to explore how IEC has been prioritised in Indian budgets. From the Union Budget data, three major heads have been identified in this regard (though not consistently available for all the studied years)- IEC under Swachh Bharat Mission or SBM (under the Dept. of Drinking Water and Sanitation, Jal Shakti Ministry), Information and mass communication under the Mission for Protection and Empowerment for Women (Centrally sponsored scheme-Under MWCD) and Development Communication under Ministry of Information and Broadcasting. Publicity of the policies and programmes of the Government of India is undertaken by the Ministry of Information and Broadcasting through its media units, mainly through Press Information Bureau (PIB) and Bureau of Outreach and Communication (BOC). As per the response of the Lok Sabha un-starred question no. 3401 (2018), “Under Swachh Bharat Mission (Gramin), up to five per cent of total resources can be spent on Information, Education and Communication (IEC) for State and District level. Three per cent of the resources can be used at the Central level for the same purpose. Massive media campaigns have been started at National level using Audio Visual (TV) and Audio (Radio). States are also carrying out IEC campaigns that use interpersonal Communication (IPC) techniques. Cleanliness campaigns are held at regular intervals to create social awareness. In order to educate the people, the programme lays emphasis on community involvement. Many States are focusing on community approaches, wherein the people are directly triggered and made aware about the importance of sanitation and hygiene using interactive individual/ community-based triggering tools. Besides, conventional IEC tools are also used to educate the people. Swachh Bharat Whatsapp group has been created involving officials of GoI and all the States. Similar groups for individual States have been formed. A Facebook page for SBM(G) has also been created. Celebrities have been roped in as brand ambassadors for promoting Swacch Bharat Mission”. However, the budget
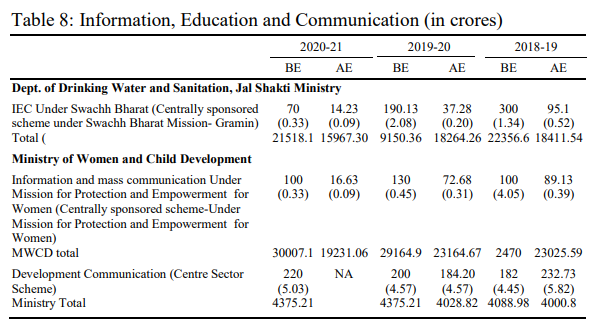
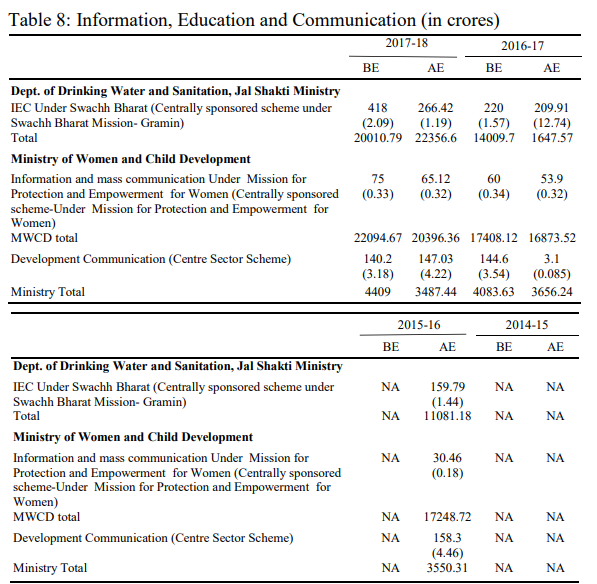
Notes: Figures in parentheses indicate percentages; NA- Not available in the Budget Documents.
allocation status does not weave much hope. In terms of IEC under SBM, there has been a 68 per cent decline between 2016-2017 and 2020-2021. The actual expenditure was 31.7 per cent of the BE in 2018-2019 which was a drop from about 64 per cent of the BE in 2017-2018. The MWCD houses several important schemes such as the Beti Bachao Beti Padhao, Swadhar Greh, Ujjwala, to name a few, under the Mission for Empowerment of Women. The allocations for information and mass communication under this Mission have tended to fluctuate. While it was about four per cent of the total allocations for the Mission in 2018- 2019, it declined to less than 0.5 per cent during 2019-2020 and 2020-2021. Such meagre allocations for information and mass communication is bound to be fraught with untoward consequences, given that it is not possible to bring about women’s empowerment in its truest sense without adequately engaging with the perceptions and behaviour of the community. This also has implications for nutrition, as already discussed. Allocations on development communication under
the Ministry of Information and Broadcasting hovered around 4-5 per cent with moderate fluctuations. The actual expenditure was also not poor, in fact exceeded the BE during specific years. Over-all, the situation on government spending on IEC is grim.
II Conclusion
The condition of malnutrition in India is deeply deplorable. It has the highest burden of malnutrition among the South Asian countries and one of the highest in the world. Notwithstanding the fact that the government launched several schemes with renewed vigour during the 2010s, according to the MWCD, the total outlays on nutrition as a development head decreased from 20.7 crores (2.09 per cent of total Central plan outlays) in 2014-2015 to 15.32 crores (0.38 per cent of total social services outlays) in 2020-2021. However, there has been some positive change in terms of actual expenditure. The actual expenditure on nutrition increased from 43.7 per cent of the total BE in 2014-2015 to about 93.9 per cent of total BE in 2018-2019. In 2019-2020, the Revised Estimate (RE) exceeded BE. However, focusing on nutrition specific interventions is not enough to steer India out of its dismal malnourished condition. The Lancet 2013 series note that child stunting (i.e., low height-for-age) can be reduced by only about 20 per cent, should the nutrition-specific, interventions be scaled up to 90 per cent coverage, whereas nutrition-sensitive interventions must be put into place if the remaining 80 per cent reduction in stunting is to be achieved (Bhutta, et. al. 2013). This paper points out that for most of the identified sectors that affect nutrition indirectly, the allocations as percentage to total outlays of the concerned Ministries/Departments is decreasing. Some positive trends do exist, with Beti Bachao Beti Padhao, National Rural Livelihood Mission and Pradhan Mantri Krishi Sinchai Yojana experiencing an increase in outlays as well as utilisation of funds. Merely these would not suffice. More concerted efforts need to be made in terms of increasing budgetary allocations for nutrition-sensitive interventions, particularly sanitation, women’s empowerment, education, health, food security and IEC, if India is to emerge as “Kuposhan Mukt Bharat”.
Endnotes
1. Several States in India have formulated their respective Nutrition Missions such as Atal Baal Mission in Madhya Pradesh; Baal Sukham in Gujarat and now Kuposhan Mukt Gujarat Maha Abhiyan; Rajmata Jijau Mission in Maharashtra; State Nutrition Missions in Uttar Pradesh, Karnataka and Jharkhand; Mission Manav Vikas in Bihar and Social Empowerment Mission in Andhra Pradesh, among others. Resources for these State Missions mostly include additional State resources, as well as some external resources too.
2. India plus Interventions is a set of 14 nutrition interventions mapped by the IFPRI in 2015. These are included in India’s policy framework and also supported by recommendations from a large network of stakeholders in India, the Coalition for Food and Nutrition Security in India 2010. These interventions are based on latest demographic projections, local costing data based on programmatic experience that are compiled from numerous credible sources in India including the MoWCD, the NRHM, UNICEF India, Alive and Thrive and the Micronutrient Initiative. The indicators are: (a) Behaviour-Change interventions- counselling for mothers during pregnancy, counselling for optimal breast feeding to caregivers of children 0-6 months, counselling for complementary feeding and hand washing to caregivers of children 0-6 months; (b) micronutrient and deworming interventions: Vitamin A supplementation for children 6-59 months, ORS and therapeutic zinc supplements for treatment of diarrhoea for children 2-59 months, deworming for children 12-59 months, deworming for adolescents 11- 18 years, iron supplements for 6-59 months children, iron-folic supplements for adolescents 11-18 years, iron supplements for pregnant and lactating women; (c) complementary and therapeutic feeding interventions- complementary food supplements, supplementary food rations, additional food rations for severely malnourished children;(d) Severe Acute Malnutrition (SAM) treatment- facility-based treatment for children 6-59 months; (e) Others- Insecticide treated nets for pregnant women in Malaria.
3.Kadiyala, et. al. (2014) identified three different pathways between women’s work in agriculture and child nutrition outcomes, both positive and negative. First, through increased income and control over it, women are likely to have greater say in matters of household expenditures on food and health, patterns of food consumption and dietary diversities etc. Second, for younger children, women’s work away from household and lack of proper breastfeeding facilities in the worksites would mean that these children would be deprived from the nutritional benefits of mothers’ milk. Also, their supplementary feeding is also likely to get affected due to paucity of time for the mothers. Several scholars, in fact, have discussed about a time trade-off between care work and paid work (Engle, Menon, and Haddad 1999). Thirdly, increased double burden work casts a negative impact of the women’s health (Bamji and Thimayamma 2000), and in turn, their ability to care for their children’s health and nutrition (see recent reviews by Vijay Pandey, et. al. 2016 and Marie T. Ruel, et. al. 2018).
Kadiyala, et. al. (2014) conclude that seasonally high work burdens in agriculture have negative impact on nutritional outcomes, both of their children and themselves, “through time trade-offs, and their own health, due to energy stress”. Johnston, et. al. (2018) in their systematic review observe that although women play key role in agriculture, there is no clear- cut evidence of the interlinkages between women’s agriculture work and nutrition. In fact, they found that the nutritional implications vary with the characteristics of the households and how the members respond to seasonal shifts of work burden in agriculture. They further observe that household responses are influenced by factors like household income and ability to purchase food, household type and composition (in particular, the presence of members who can take up domestic work), seasonality in the organization of agricultural labour, and work intensity, which refers to energy expenditure. According to Johnston (2018), women could cope with such seasonalities through switching of tasks, altering the mix of occupations, falling back upon social organization and support, etc.
Affiliation
Tanusree Paul, Assistant Professor, Women’s Studies Centre, Visva-Bharati, Santiniketan, Birbhum
District 731235, West Bengal, Email: paul.tanusree@gmail.com
Reference
Alzua, M.L., A.J. Pickering, H. Djebbari, F.C. Lopez, J.C. Cardenas, M.A. Lopera, et. al. (2015), Impact Evaluation of Community-led Total Sanitation (CLTS) in Rural Mali: Final Report, Buenos Aires: Universidad Nacional de La Plata, Facultad de Ciencias Económicas, Centro de Estudios Distributivos, Laborales y Sociales (CEDLAS), (http://www.cedlas- er.org/sites/default/files/ cer_evaluation_files/mali-clts-impact-evaluation-2014.pdf, accessed 7 September 2015).
Arimond, M. and M. Ruel (2006), Dietary Diversity is Associated with Child Nutritional Status: Evidence from 11 Demographic and Health Surveys, Journal of Nutrition, 134(10): 2579- 2585.
Behrman, J.R. and B.L. Wolfe (1984), More Evidence on Nutrition Demand: Income Seems Overrated and Women’s Schooling Underemphasized, Journal of Development Economics, 14(1): 105-128.
Bhagowalia, Priya, Purnima Menon, Agnes R. Quisumbing and Vidhya Soundararajan (2012), What Dimensions of Women’s Empowerment Matter Most for Child Nutrition? Evidence Using Nationally Representative Data from Bangladesh, IFPRI Discussion Paper 01192, (http://ebrary.ifpri.org/cdm/ref/collection/p15738coll2/id/127005, Accessed on 23rd December, 2019).
Centre for Budget and Governance Accountability (CBGA) (2016), Budget Track, Volume 11, (http://www.cbgaindia.org/budget-tracks/volume-11-2016/, Accessed on 6th January, 2020).
Chib, A. and R. Aricat (2012), Seeking the Non-Developmental Within the Developmental: Mobile Phones in the Globalized Migration Context, Can Emerging Technologies Make a Difference in Development, In Emerging Economies, Emerging Technologies: Can Technology Make a Difference in Development? R. Parker and R.P. Appelbaum (Eds.), New York: Routledge, pp. 153-167.
Coffey, Diane, Aashish Gupta, Payal Hathi, Nidhi Khurana, Dean Spears, Nikhil Srivastav, Sangita Vyas (2014), Revealed Preference for Open Defecation- Evidence from a New Survey in Rural North India, Economic and Political Weekly, 49(38): 43-55.
Fink, G., I. Gunther, K. Hill (2011), The Effect of Water and Sanitation on Child Health: Evidence from the Demographic and Health Surveys 1986–2007, International Journal of Epidemiology, 40(5): 1196–1204.
Gonmei, Zaozianlungliu and G.S. Toteja (2018), Micronutrient Status of Indian Population, Indian J Medical Research, 148(5): 511-521.
Headey, Derek D. (2013), Development Drivers of Nutritional Change: A Cross-Country Analysis,
World Development, 42: 76-88.
Indian National Science Academy (2011), Micro-Nutrient Security for India– Priorities for Research and Action, https://insaindia.res.in/pdf/Micronutrient-Complete.pdf
Johnston, D., S. Stevano, H. Malapit, E. Hull and S. Kadiyala (2018), Review: Time Use as an Explanation for the Agri-Nutrition Disconnect: Evidence from Rural Areas in Low- and Middle-Income Countries, Food Policy, 76 (2018): 8–18.
Kadiyala, Suneetha, Jody Harris, Derek Headey, Sivan Yosef and Stuart Gillespie (2014), Agriculture and Nutrition in India: Mapping Evidence to Pathways, Annals of the New York Academy of Sciences, pp. 1-14.
Malapit, H.J.L., S. Kadiyala, A.R. Quisumbing, K. Cunningham, P. Tyagi (2013), Women’s Empowerment in Agriculture, Production Diversity and Nutrition, IFPRI Discussion Paper 01313 (http://ebrary.ifpri.org/cdm/ref/collection/p15738coll2/id/127984, accessed 21st November 2020).
Pandey, Vijay Laxmi, S. Mahendra Dev and Usha Jayachandran (2016), Impact of Agricultural Interventions on the Nutritional Status in South Asia: A Review, Food Policy, 62(2016): 28- 40.
Ramesh, R., and P. Siva Ram (2015), Behavioural Change Communication – A Companion to the Facilitators of Swaccha Bharat Mission, Centre for Rural Infrastructure, NIRD & amp; PR, Hyderabad
Ruel, M.T., H. Alderman, Maternal and Child Nutrition Study Group (2013), Nutrition Sensitive Interventions and Programmes: How Can They Help to Accelerate Progress in Improving Maternal and Child Nutrition? The Lancet, 382(9891): 536–551.
Shrivastava, Saumya and Chandrika Singh (2017), Manual for Tracking Direct Nutrition Interventions’ Budgets using Budget Tracking and Analysis Too, Centre for Budget and Governance Accountability and UNICEF, Accessed on 12 May, 2020 fromhttp://www.cbgaindia.org/wp-content/uploads/2018/04/Manual-for-Tracki’ng-Direct- Nutrition-Interventions-Budgets-using-Budget-Tracking-and-Analysis-Tool-2.pdf
Spears, D., A. Ghosh, O. Cumming (2013), Open Defecation and Childhood Stunting in India: An Ecological Analysis of New Data from 112 Districts, PLoS One, 8(9): e73784.
Stark, Laura (2010), Mobile Technology, Gender and Development in Africa, India and Bangladesh,
ElorE (ISSN 1456-3010), 17(1):147-152.
Tenhunen, Sirpa (2008), Mobile Technology in the Village: ICTs, Culture, and Social Logistics in India, Journal of the Royal Anthropological Institute (N.S.), 14( 3): 515–534.
UNICEF (2013), Capacity Building to Strengthen Local Government and Community Participation in Multi Sectoral Nutrition Programmes in Nepal (http://archive.wphna.org/wp-content/uploads/2013/10/multisectoral-nutrition-programs-NEPAL.pdf accessed on 6 November 2019).